
Download
ORIGINAL ARTICLE
Retinol-binding protein 4 and plasminogen activator inhibitor-1 as potential prognostic biomarkers of non-allergic asthma caused by obesity in adolescents
José J. Leija-Martíneza, b#, Karla L. Patricio-Románb, c#, Blanca E. Del-Río-Navarroa, d, Salvador Villalpando-Carrióne, Juan Antonio Reyes-Garayb, Juan Manuel Vélez–Reséndizf, Rodrigo Romero-Navab, c, Fausto Sanchéz-Muñoza, g, Santiago Villafañac, Onofre Muñoz-Hernándeza, Enrique Hongh, Maria Esther Ocharan Hernándezc*, Fengyang Huanga, b*
aUniversidad Nacional Autónoma de México, Programa de Maestría y Doctorado en Ciencias Médicas, Odontológicas y de la Salud, Mexico City, Mexico
bHospital Infantil de Mexico Federico Gómez, Research Laboratory of Pharmacology, Mexico City, Mexico
cLaboratorio de Señalización Intracelular, Sección de Estudios de Posgrado e Investigación, Escuela Superior de Medicina, Instituto Politécnico Nacional, Mexico City, México
dHospital Infantil de México Federico Gómez, Department of Pediatric Allergy Clinical Immunology, Mexico City, Mexico
eHospital Infantil de México Federico Gómez, Department of Gastroenterology and Nutrition, Mexico City, Mexico
fLaboratorio Multidisciplinario de nanomedicina y de Farmacología Cardiovascular, Sección de Estudios de Posgrado e Investigación, Escuela Superior de Medicina, Instituto Politécnico Nacional, Mexico City, Mexico
gDepartamento de Inmunología, Instituto Nacional de Cardiología “Ignacio Chávez”, Mexico City, Mexico
hDepartment of Pharmacobiology, Centro de Investigacion de Estudio Avanzados del Instituto Politecnico Nacional, Mexico City, Mexico
Abstract
Background: Non-allergic asthma caused by obesity is a complication of the low-grade chronic inflammation inherent in obesity. Consequently, the serum concentrations of adipokines such as retinol-binding protein 4 (RBP4) and plasminogen activator inhibitor-1 (PAI-1) increase. No gold standard molecule for the prediction of non-allergic asthma among obese patients has been identified.
Objective: To evaluate RBP4 and PAI-1 as prognostic biomarkers of non-allergic asthma caused by obesity.
Methods: A cross-sectional study between four groups of adolescents: (1) healthy (n = 35), (2) allergic asthma without obesity (n = 28), (3) obesity without asthma (n = 33), and (4) non-allergic asthma with obesity (n = 18).
Results: RBP4 was higher in the non-allergic asthma with obesity group than in the obesity without asthma group (39.2 ng/mL [95% confidence interval (CI): 23.8–76.0] vs. 23.5 ng/mL [95% CI: 3.2–33.5], p < 0.01), and PAI-1 was higher in the non-allergic asthma with obesity group than in the obesity without asthma group (21.9 ng/mL [95% CI: 15.7–26.5] vs. 15.9 ng/mL [95% CI: 9.4–18.2], p < 0.05). Receiver operating characteristic (ROC) curve analysis demonstrated that the serum RBP4 cut-off value was >42.78 ng/mL, with an area under the ROC curve (AUC) of 0.741 (95% CI: 0.599–0.853, p = 0.001), considered acceptable. The PAI-1 cut-off value was >12.0 ng/mL, with an AUC of 0.699 (95% CI: 0.554–0.819, p = 0.008), considered fair.
Conclusions: RBP4 may be useful to predict non-allergic asthma among obese adolescents in clinical practice.
Key words: non-allergic asthma, obesity, prognostic, biomarker, RBP4, PAI-1
*Corresponding authors: Maria Esther Ocharan Hernández and Fengyang Huang. Dr. Márquez 162, Col. Doctores, C.P. 06720, Del. Cuauhtemoc, Mexico City, Mexico. Email address: [email protected]; [email protected]
#These authors contributed equally to this work.
Received 11 April 2020; Accepted 18 November 2020 Available online 1 May 2021
Copyright: Leija-Martínez JJ, et al.
License: This open access article is licensed under Creative Commons Attribution 4.0 International (CC BY 4.0). http://creativecommons.org/licenses/by/4.0/
Introduction
Obesity and overweight are defined by the World Health Organization (WHO) as “abnormal or excessive fat accumulation that may impair health.”1 Every year, at least 2.8 million people die of overweight and obesity.1 Asthma is defined according to the Global Initiative for Asthma (GINA)2 as “a heterogeneous disease, usually characterized by chronic airway inflammation. It is defined by the history of
respiratory symptoms such as wheeze, shortness of breath, chest tightness, and cough that vary over time and in intensity, together with variable airflow limitation. Airflow limitation may later become persistent.” According to the WHO, 235 million people in the world suffer from asthma.3
Obesity causes a low-grade chronic inflammatory state, and this inflammation has been associated with non-allergic asthma, metabolic diseases, autoimmune diseases, and certain types of cancer.4 Systematic reviews and meta-analyses have shown that obesity precedes asthma and that an increase in body mass index (BMI) increases the relative risk (RR) of suffering from asthma throughout the life in both children and adults.5–7
Holguin et al.8 described a special phenotype of non-allergic asthma caused by obesity. With late onset, this asthma starts after age 12, is more common in women, is more severe than regular asthma, and is resistant to inhaled steroids. It is characterized by a Th1 and Th17 immune response with increased levels of TNF-α, IL-β, IL-6, and IL-17A.9–11
The main cell type in visceral adipose tissue in obesity is type 1 macrophages (M1), which are the main source of inflammatory interleukins, such as tumor necrosis factor (TNF)-α, interleukin (IL)-1β, and IL-6, which cause low-grade chronic inflammation.12,13 This low-grade chronic inflammation is mainly orchestrated by TNF-α, IL-1β, IL-6, and IL-17A.14 These interleukins play important roles because they cause structural and irreversible damage to the respiratory epithelium in this group of patients.15 As a consequence of this chronic inflammation, serum concentrations of certain adipokines are increased, such as retinol-binding protein 4 (RBP4) and plasminogen activator inhibitor-1 (PAI-1).16
Serum RBP4 is the only hepatocyte-secreted factor responsible for the transport of retinol (vitamin A) in the circulation and is secreted by M1 macrophages and adipocytes.17 In the pediatric population, Huang et al.18 reported that the concentration of RBP4 is higher in obese adolescents than in healthy adolescents. Few clinical studies of the association between RBP4 and asthma have been reported, and their findings are controversial.19,20
Retinol-binding protein 4 is produced mainly by adipocytes and by M1 macrophages located in visceral adipose tissue,21 and according to Periyalil et al.,22 patients with asthma and obesity have a greater number of M1 macrophages in visceral adipose tissue than obese patients without asthma. Consequently, patients with non-allergic asthma caused by obesity can be assumed to have higher serum concentrations of RBP4 than patients with obesity without asthma.
Plasminogen activator inhibitor-1 is an adipokine that is upregulated in obesity mainly in visceral adipose tissue, and its main function is inhibiting fibrinolysis.23,24 The deposition of fibrin and collagen is a characteristic of remodeling in the respiratory epithelium in asthmatic patients.25 PAI-1 induces the deposition of fibrin in the airways, inhibiting the activation of the active enzyme plasmin by tissue-type plasminogen activator (t-PA) or urokinase-type plasminogen activator (u-PA), which both degrade fibrin. Therefore, there is no fibrinolysis, and as a result, there is an increase in the deposition of fibrin in the extracellular matrix of the bronchial epithelium, so the respiratory epithelium will have irreversible damage and bronchial remodeling.26,27 Studies in murine models such as those by Eitzman et al.,28 Oh et al.,29 and Swaisgood et al.30 concluded that PAI-1 plays an important role in the deposition of fibrin in the respiratory tract in the murine asthma model. Few clinical studies have explored the association between PAI-1 and asthma, and the phenotypes of asthma in such studies are heterogenous; consequently, the results are controversial.31,32
Plasminogen activator inhibitor-1 is increased in obesity33; therefore, in patients with superimposed inflammatory diseases, such as obesity and asthma, serum concentrations of PAI-1 can be logically assumed to be higher than those in healthy individuals, individuals with allergic asthma without obesity, and individuals with obesity without asthma.
The multifactorial etiology of non-allergic asthma caused by obesity imposes an important limitation on the treatment of this disease.34–36 The most important intervention is to prevent the disease in obese patients. Unfortunately, the general practitioner, pediatrician, and allergist do not currently have a biomarker that can predict non-allergic asthma in obese patients. The aim of the present study was to evaluate RBP4 and PAI-1 as potential prognostic biomarkers of non-allergic asthma caused by obesity.
Based on a previous theory, our hypothesis is based on the fact that adolescents with non-allergic asthma caused by obesity present greater low-grade chronic inflammation than healthy adolescents, adolescents with allergic asthma without obesity, and obese adolescents without asthma.
Materials and methods
Study design
A cross-sectional study of four groups of adolescents was carried out from June 2018 to October 2019. All patients were sampled by convenience in the Department of Allergy and Paediatric Clinical Immunology and in the Obesity Clinic of the Children’s Hospital of Mexico Federico Gómez, Mexico City.
Ethical approval
The study was approved by the research, ethics in research, and biosecurity committee of the Children’s Hospital of Mexico Federico Gómez with an approval number HIM/2013/015. This study adhered to the Declaration of Helsinki (2013)37 and was conducted in accordance with the Mexican Regulation for Research in the Field of Health. Before any procedures, the parents of all participating adolescents signed informed consent, and the patients themselves also signed informed assent. No patient was identified during the study, and all data were kept confidential.
Subjects
The following four groups of adolescents were established: (1) healthy, (2) allergic asthma without obesity, (3) obesity without asthma, and (4) non-allergic asthma with obesity. The age range of all subjects was 11–18 years. The inclusion criteria for the allergic asthma without obesity group were a diagnosis of asthma determined by a physician according to the clinical criteria of GINA 20182; an asthma evolution ≥6 months; a positive skin prick test (SPT) for at least one air allergen; asthma confirmation by spirometry with an inhaled β2-agonist with reversibility ≥12% or 200 mL of the forced expiratory volume in 1 second (FEV1) with respect to the baseline value; well- or partially controlled asthma; and a normal BMI. For the obesity group, the inclusion criterion was a BMI ≥95th percentile as defined by the National Center for Health Statistics, Centers for Disease Control and Prevention [CDC].38 Finally, the criteria for the non-allergic asthma with obesity group were a BMI ≥95th percentile according to the CDC38; obesity before the onset of asthma; a diagnosis of asthma determined by a doctor according to the clinical criteria of GINA 20182; asthma evolution ≥6 months; a negative SPT; asthma confirmation by spirometry with an inhaled β2-agonist with reversibility ≥12% or 200 mL of the FEV1 compared to the baseline value; and well- or partially controlled asthma. The exclusion criteria for the four groups were systemic and chronic degenerative diseases and treatment with systemic steroids in a cut-off or continuous cycle within 3 months before measurement of the serum concentrations of the adipokines. Elimination criteria: the voluntary decision of parents/guardians or patients to withdraw from the study at any time (their medical care was continued).
Protocol and laboratory measurements
The first visit included a medical history, a physical exam by a pediatric allergist, anthropometric measurements collected by a trained nutritionist, and, if the eligibility criteria were met, signing of the informed consent by the parents/guardians and patients. A spirometry test was performed on all patients with asthma using a spirometer (Vmax Spectra 209, Yerba Linda, CA, USA) by a technician trained in respiratory physiology. FEV1 was adjusted for differences in age, sex, and height using Polgar values to obtain the percentage of predicted values of FEV1.39 The spirometric procedure was performed according to standardization criteria last recommended by the American Thoracic Society and European Respiratory Society.40 All patients with asthma underwent SPT for aeroallergens (Dermatophagoides pteronyssinus, Dermatophagoides farinae, Blattella germanica, Periplaneta americana, standardized cat hair, dog epithelium, and pollens of grasses, weeds, and trees) (ALK-Abelló®, Copenhagen, Denmark), with positive control of histamine and negative control of glycerin. Asthma was considered allergic if the size of the hive was ≥3 mm.
Height was measured to the nearest 0.5 cm using a stadiometer, and weight was measured to the nearest 0.1 kg using a medical balance (Health Metre 402 KL, USA). When weighed, the participants wore light clothing and took off their shoes. BMI was calculated by the standard formula, (weight in kilograms)/(height in metres2). Tanner stage was assessed according to the standardized method.41
On the second visit, a blood sample of 10 mL from the left cubital vein (at 8 to 9 am, after 12 h of fasting) was taken. The concentration of RBP4 was determined by enzyme-linked immunosorbent assay (ELISA) (Millipore, USA). To assess PAI-1, serum and plasma were frozen and kept at -70°C until analysis, and the concentration of PAI-1 in citrated plasma was determined by ELISA (Oncogene-Science, Cambridge, MA, USA). Finally, on the third visit, the results of adipokine concentrations were given to the parents/guardians and patients.
Statistical analysis
The data are presented as the medians and their respective 95% confidence intervals (CIs), and the ordinal and qualitative variables are presented as frequencies and percentages. The Kruskal–Wallis test was carried out to identify significant differences in medians, and the Wilcoxon signed-rank test was performed as a post hoc analysis to determine which groups were significantly different. Comparisons of proportions were analyzed by Pearson’s Chi-squared test. To evaluate the accuracy of adipokines as prognostic indicators, receiver operating characteristic (ROC) curve analysis was performed, and the area under the curve (AUC) and the best cut-off was defined as the value maximizing the Youden’s index with their respective sensitivity, specificity, positive predictive value (PPV), and negative predictive value (NPV).42 A multivariate linear regression model was used to adjust confounding variables. MedCalc® software, version 19.5.2 (Belgium) and GraphPad® Prism software, version 8 (La Jolla, CA) were used for ROC curve analysis. In all analyses, a value of p < 0.05 with a 95% CI was considered statistically significant. All data were evaluated with IBM® SPSS® Statistics v. 22.0 (SPSS, Inc., IBM, Chicago, IL, USA).
Results
With regard to demographic and baseline characteristics, patients with obesity without asthma were younger than the healthy subjects and those in the allergic asthma without obesity group and shorter than those in the non-allergic asthma with obesity group. There were no differences in the proportion of the sexes and Tanner stage between the four groups (Table 1).
Table 1 Demographic and baseline characteristics.
| Healthy (n = 35) | Allergic asthma without obesity (n = 28) | Obesity without asthma (n = 33) | Non-allergic asthma with obesity (n = 18) | p-Value | |
|---|---|---|---|---|---|
| Age (years) | 13.4 (12.7, 14.5) | 14.0 (13.1, 14.5) | 11 (11.0, 14.5) &&### | 13.0 (11.4, 15.6) | <0.01 |
| Male, n (%) | 19 (54.3%) | 16 (57.1%) | 19 (57.6%) | 13 (72.2%) | 0.6* |
| Tanner stage II, III, IV, V (n) | 13, 7, 15, 0 | 4, 10, 11, 3 | 17, 8, 7, 1 | 4, 6, 7, 1 | 0.07* |
| Weight, kg | 48.0 (42.8, 51.6) | 49.1 (47.0, 52.2) | 65.7 (57.3, 71.8) &&&### | 69.2 (63.4, 79.9) &&&### | <0.001 |
| Height, cm | 156.0 (153.0, 160.0) | 156.0 (153.0, 163.0) | 152.0 (145.0, 158.0) | 159.0 (152.0, 169.0) ψ | <0.05 |
| BMI, kg/m2 | 19.4 (17.7, 20.5) | 20.0 (19.2, 20.8) | 27.3 (25.5, 29.2) &&&### | 27.8 (26.8, 30.7) &&&### | <0.001 |
| BMI percentile, % | 50.0 (25.0, 50.0) | 50.0 (25.0, 50.0) | 95.1(95.1, 96.4) &&&### | 96.1 (95.1, 97.7) &&&### | <0.001 |
| BMI z-score | 0.08 (−0.5, 0.5) | 0.36 (−0.6, 0.6) | 1.9 (1.8, 2.0) &&&### | 1.9 (1.8, 2.1) &&&### | <0.001 |
| RBP4, ng/mL | 12.7 (3.2, 19.9) | 27.6 (3.8, 43.9) | 23.5 (3.2, 33.5) | 39.2 (23.8, 76.0) &&&ψψ | < 0.01 |
| PAI-1, ng/mL | 12.6 (10.0, 17.0) | 16.7 (8.4, 22.3) | 15.9 (9.4, 18.2) | 21.9 (15.7, 26.5) &&ψ | 0.05 |
*Pearson’s chi-squared test.
Values are expressed as the median and 95% confidence intervals.
BMI: body mass index; RBP4: retinol-binding protein 4; PAI-1: plasminogen activator inhibitor-1.
&& p < 0.01 vs. healthy; &&& p<0.001 vs. healthy; ### p < 0.001 vs. allergic asthma without obesity; ψ p < 0.05 vs. obesity without asthma; ψψ p < 0.01 vs. obesity without asthma.
As expected, both groups of adolescents with obesity had higher weight, BMI, BMI percentile, and BMI z-score than the two groups without obesity. There were no differences in the weight, BMI, BMI percentile, and BMI z-score between the non-allergic asthma with obesity group and the obesity without asthma group (Table 1).
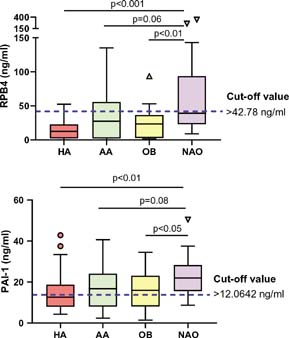
The non-allergic asthma with obesity group had the highest serum concentration of RBP4. Notably, the non-allergic asthma with obesity group had higher serum RBP4 levels than the obesity without asthma group. No statistically significant differences were found between the healthy, allergic asthma without obesity and obesity without asthma groups (Table 1 and Figure 1).
Figure 1 Serum levels of RBP4 and PAI-1 in the four groups of adolescents. The data are presented as the median and interquartile range (IQR). The Kruskal–Wallis test with Wilcoxon signed-rank test post hoc analysis was performed to test for significant differences between the medians; the p-values are shown in the figure; blue dashed lines represent the cut-off value calculated for each adipokine according to Youden’s index.
The non-allergic asthma with obesity group also had higher serum PAI-1 levels than the healthy and obesity without asthma groups. Important to our hypothesis, the non-allergic asthma with obesity group had higher serum PAI-1 levels than the obesity without asthma group. We did not observe any statistically significant differences between the healthy, allergic asthma without obesity and obesity without asthma groups (Table 1 and Figure 1).
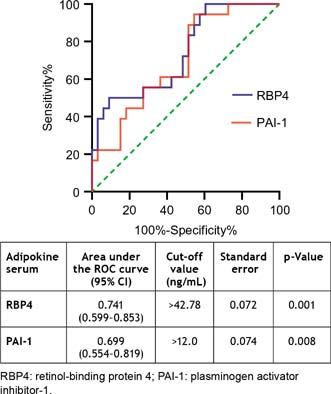
To evaluate the accuracy of RBP4 and PAI-1 as diagnostic tests for prognosis, ROC curve analysis was performed only in the obesity without asthma and non-allergic asthma with obesity groups. As shown in Figure 2, when the cut-off value for RBP4 was set to >42.78 ng/mL, the ROC curve had an AUC value of 0.741 (95% CI: 0.599–0.853) (p = 0.001), indicating that RBP4 had a 74.1% probability of accurately discriminating whether an obese adolescent had the outcome of non-allergic asthma.
Figure 2 Comparison of the receiver operating characteristic (ROC) curves for RBP4 and PAI-1 between adolescents with obesity without asthma and adolescents with non-allergic asthma with obesity.
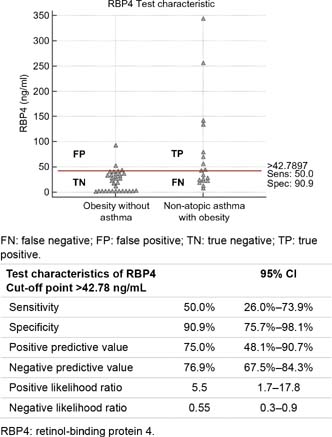
Figure 3 shows the test characteristics of RBP4; the sensitivity was low, so there was a 50% probability of a false negative; however, the accuracy of the diagnostic test was compensated by the high specificity of 90.9%.
Figure 3 Interactive dot diagram comparing the levels of RBP4 between adolescents with obesity without asthma and adolescents with non-allergic asthma with obesity.FN: false negative; FP: false positive; TN: true negative; TP: true positive.
Interestingly, the cut-off for RPB4 is close to the median of the non-allergic asthma with obesity group; therefore, RBP4 has poor sensitivity (50%). Nevertheless, the cut-off point was substantially higher than the median of the obesity group without asthma; thus, it is specific enough (90.9%) to identify non-allergic asthma in an adolescent with obesity in clinical practice (Figures 1 and 3).
When the cut-off value for PAI-1 was set to >12.0 ng/mL, the ROC curve had an AUC of 0.699 (95% CI: 0.554–0.819) (p = 0.008), indicating that PAI-1 had a nearly 70.0% probability of accurately discriminating whether an adolescent with obesity had the outcome of non-allergic asthma (Figure 2).
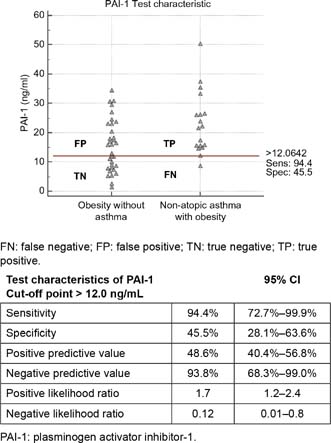
Figure 4 shows the test characteristics of PAI-1; the specificity of 45.5% was low, so there was a 54.5% probability of a false positive; however, the accuracy of the diagnostic test was compensated by a high sensitivity of 94.4%. In addition, the cut-off value was notably lower than the medians of both the non-allergic asthma with obesity group and the obesity without asthma group. Consequently, PAI-1 is very sensitive (94.4%) but has poor specificity (45.5%) (Figures 1 and 4).
Figure 4 Interactive dot diagram comparing the levels of PAI-1 between adolescents with obesity without asthma and adolescents with non-allergic asthma with obesity.
The serum concentrations of RBP4 and PAI-1 were associated with non-allergic asthma with obesity. An obese patient with a serum RBP4 concentration >42.78 ng/mL was 10 times more likely to suffer from non-allergic asthma than a patient with a concentration ≤42.78 ng/mL [OR: 10.0 (95% CI: 2.2–45.0), p ≤ 0.01]. In addition, an obese adolescent with a serum PAI-1 concentration >12 ng/mL had a 14-fold greater likelihood of having non-allergic asthma than an obese patient with a serum PAI-1 concentration ≤12.0 ng/mL [OR: 14.2 (95% CI: 1.7–119.2), p ≤ 0.01].
There were no differences in RBP4 between males versus females (20.1 ng/mL [95% CI: 12.7–33.9] vs. 22.6 ng/mL [95% CI: 10.9–29.0], p = 0.6) or in PAI-1 between males versus females (16.7 ng/mL [95% CI: 12.8–18.4] vs. 15.1 ng/mL [95% CI: 11.9–18.2], p = 0.5). The sex, age, and Tanner stage showed no independent effects on the serum concentrations of RBP4 and PAI-1 in the four groups (Table 2).
Table 2 Multivariate linear regression model adjusted for the variables sex, age, and Tanner stage in the four groups of adolescents.
| RBP4 n = 114 Adjusted R2 = 0.16 | PAI-1 n = 114 Adjusted R2 = 0.03 | |||
|---|---|---|---|---|
| β (95% CI) | p-Value | β (95% CI) | p-Value | |
| Sex | ||||
| Female | Reference | Reference | ||
| Male | 3.8 (−13.2, 20.9) | 0.7 | 0.5 (−3.4, 4.3) | 0.8 |
| Age | ||||
| Age, years | −2.5 (−9.7, 4.6) | 0.5 | 0.9 (−0.7, 2.6) | 0.2 |
| Tanner stage | ||||
| Tanner II | Reference | Reference | ||
| Tanner III | 4.7 (−17.6, 26.9) | 0.7 | −1.6 (−6.7, 3.4) | 0.5 |
| Tanner IV | −5.3 (−33.1, 22.5) | 0.7 | −4.9 (−11.1, 1.4) | 0.1 |
| Tanner V | −12.2 (-64.0, 39.7) | 0.6 | −6.9 (−18.7, 4.8) | 0.2 |
| Groups | ||||
| Non-allergic asthma with obesity | Reference | Reference | ||
| Healthy | −60.1 (−85.9, −34.4) | <0.001 | −8.0 (−13.9, −2.2) | <0.001 |
| Allergic asthma without obesity | −36.9 (−63.4, −10.3) | 0.01 | −5.9 (−11.9, 0.06) | 0.05 |
| Obesity without asthma | −56.8 (−83.0, −30.6) | <0.001 | −7.7 (−13.7, −1.8) | 0.01 |
RBP4: retinol-binding protein 4; PAI-1: plasminogen activator inhibitor-1.
Discussion
As shown in Table 1 and Figure 1, the findings of this study partially support our hypothesis. The non-allergic asthma with obesity group had higher serum RBP4 concentrations than the healthy and obesity without asthma groups, similarly Huang et al.,20 who found no significant difference in serum RBP4 between the non-allergic asthma with obesity and asthma without obesity groups.
Regarding serum PAI-1 concentrations, our hypothesis was partially supported: The non-allergic asthma with obesity group had higher PAI-1 concentrations than the healthy and obesity without asthma groups. Interestingly, the findings in the allergic asthma without obesity group do not support our hypothesis. These findings are different from those reported by Cho et al.,32 where patients with asthma and obesity had higher PAI-1 concentrations than patients with asthma without obesity. Notably, the characteristics of the patients in the study by Cho et al.32 are different from those in our study: they studied adult patients, and the asthma phenotype was different; their patients with asthma and obesity did not exclusively have the non-allergic form; and not all patients with asthma without obesity were exclusively allergic.
The phenotype of allergic asthma without obesity is not within the causal chain of non-allergic asthma caused by obesity, but it was included to study how inflammatory adipokines behave in this group of patients. That is, the origin of allergic asthma is mainly a Th2 immune response with an elevation of IL-4, IL-5, and IL-13, resulting in elevated levels of specific immunoglobulin E; in contrast, in non-allergic asthma caused by obesity, the cause of asthma is chronic low-grade inflammation induced mainly by TNF-α, IL-1β, IL-6, and IL-17A.9–11
A potential explanation for the lack of significant difference in PAI-1 between the classical allergic asthma group and the non-allergic asthma with obesity group is that PAI-1 biology may be important in both phenotypes. Cho et al.26,27,32 and Oh et al.29 reported that PAI-1 plays an important role in lung damage in patients with allergic asthma. PAI-1 may be essential in both asthma phenotypes, which could explain the lack of statistically significant differences.
The most important findings in our study are that patients with non-allergic asthma with obesity had higher serum RBP4 and PAI-1 levels than patients with obesity without asthma. This study demonstrated that patients with obesity who have higher concentrations of RBP4 and PAI-1 will have a greater risk of developing non-allergic asthma; thus, RBP4 and PAI-1 may be useful as prognostic biomarkers for the outcome of non-allergic asthma among adolescents with obesity. A possible explanation for this phenomenon is that individuals with non-allergic asthma caused by obesity have more M1 macrophages22 than obese subjects without asthma and therefore have greater RBP4, PAI-1, and cytokine production, which causes low-grade inflammation.16
This study demonstrated an association between the serum concentration of RBP4 and non-allergic asthma with obesity, where a cut-off value >42.78 ng/mL was taken as a risk factor for non-allergic asthma. Above this cut-off, an obese patient was 10 times more likely to develop non-allergic asthma compared to an obese patient with a concentration below the cut-off [OR: 10.0 (95% CI: 2.2–45.0), p ≤ 0.01]. Similarly, we also observed an association between the serum concentration of PAI-1 and non-allergic asthma with obesity, where a PAI-1 concentration >12.0 ng/mL was a risk factor for non-allergic asthma in the group of adolescents with obesity. According to our data, an obese patient with a concentration above this cut-off was 14 times more likely to suffer from non-allergic asthma than an obese patient with a concentration below the cut-off [OR: 14.2 (95% CI: 1.7–119.2), p ≤ 0.01]. The CIs for the ORs of both RBP4 and PAI-1 are very wide, possibly because the sample size was small and the numbers of patients with non-allergic asthma and obesity (n = 18) and patients with obesity without asthma (n = 33) were not balanced, which is an important limitation of our study.
Regarding the accuracy of a serum RBP4 >42.78 ng/mL as a diagnostic test to predict non-allergic asthma among adolescents with obesity, we can report that the AUC of 0.74 is considered acceptable, indicating that RBP4 can discriminate whether an adolescent with obesity will develop non-allergic asthma with 74% accuracy. As indicated in Figure 3, we had a 50% probability of a false negative; however, the accuracy of the test was compensated by the 9.1% probability of a false positive. The LR+ of 5.5 (95% CI: 1.7–17.8) is considered good and relevant for clinical practice. If the patient had a positive test (RBP4 > 42.78 ng/mL), they have 5.5 times the likelihood of obtaining a true-positive result compared to a false negative; however, the LR– of 0.55 (95% CI: 0.3–0.9) is considered bad and not relevant for clinical practice. Thus, with a negative test (RBP4 ≤ 42.78 ng/mL), there is a 0.55-fold greater likelihood of obtaining a false-negative result compared to a true negative, possibly because the sample number was small and the numbers of patients with the disease and without the disease were not balanced.
For the accuracy of a serum PAI-1 >12.0 ng/mL as a diagnostic test to predict non-allergic asthma among adolescents with obesity, the AUC was 0.69, which is considered fair, indicating that PAI-1 had nearly 70% accuracy in discriminating whether an adolescent with obesity would develop non-allergic asthma. The sensitivity of 94.4% is considered good, but the accuracy is diminished by the 55.5% probability of a false positive. The serum concentration of PAI-1 does not truly have clinical relevance, and the LR+ of 1.7 (95% CI: 1.2–2.4) is bad. Additionally, the PPV is not sufficient to accurately predict non-allergic asthma among obese adolescents. These values indicate that we are not certain whether a positive test (PAI-1 > 12.0 ng/mL) is a true positive or a false positive. The low specificity may be explained by the small and unbalanced sample size in each group. The LR– of 0.12 (95% CI: 0.01–0.8) is considered good. With a negative test (PAI-1 ≤ 12.0 ng/mL), there is a 0.1-fold greater likelihood of a false-negative result compared to a true negative.
Therefore, PAI-1 is unlikely to predict non-allergic asthma among obese adolescents in clinical practice. However, PAI-1 is an interesting molecule for this disease.27,29,32 Additionally, there is an association between PAI-1 and the phenotype of non-allergic asthma caused by obesity, so further research in basic and clinical immunology should be conducted.
It is also important to highlight that the confounding variables such as age, sex, and Tanner stage did not influence the serum levels of RBP4 and PAI-1.
The study has some limitations. The sample size is small, and the groups of non-allergic asthma with obesity and obesity without asthma were not balanced. As a cross-sectional study, it cannot establish a causal association. Knowledge of the biological mechanisms of these adipokines specifically in non-allergic asthma caused by obesity is limited, and more studies in basic and clinical sciences are needed to better explain this phenomenon.
In conclusion, associations exist between RBP4 and PAI-1 levels and non-allergic asthma caused by obesity, and RBP4 may be potentially useful to predict non-allergic asthma among obese adolescents. Indisputably, due to the limitations of the cross-sectional design, a longitudinal study with a greater sample size should be carried out to validate these biomarkers before physicians consider them in clinical decisions.
Acknowledgments
I am grateful to Dr. Fengyang Huang for guiding me on the path of clinical research and Karla L. Patricio Román (scholarship number CVU: 659858), who helped with the conception and design of this study as well as the literature research and the patient enrollment. Last but not least, I would like to thank the Universidad Nacional Autónoma de México, Programa de Maestría y Doctorado en Ciencias Médicas, Odontológicas y de la Salud specifically for providing the funding (scholarship number CVU 280319) from the Mexican National Council of Science and Technology (CONACYT).
Authorship contributions
All the authors conducted the literature search and worked together to construct the design and analysis. The authors accept responsibility for the content of this manuscript.
Research funding
This research protocol was supported by federal funds from the Mexican government for the Hospital Infantil de México Federico Gómez with the grant number HIM/2013/015, SSa. 1061.
Conflicts of interest
The authors report no conflicts of interest.
REFERENCES
1. World Health Organization. Obesity and overweight. [internet] [accessed January 15, 2020]. Available from: https://www.who.int/news-room/fact-sheets/detail/obesity-and-overweight
2. Global Initiative for Asthma (GINA). Global strategy for asthma management and prevention, 2019 revision. [internet] [accessed January 15, 2020]. Available from: http://www.ginasthma.org/
3. World Health Organization. Asthma. [internet] [Accessed January 20, 2020]. Available from: https://www.who.int/news-room/fact-sheets/detail/asthma
4. Kanneganti TD, Dixit VD. Immunological complications of obesity. Nat Immunol. 2012;13:707–712. 10.1038/ni.2343
5. Beuther DA, Sutherland ER. Overweight, obesity and incident asthma: a meta-analysis of prospective epidemiologic studies. Am J Respir Crit Care Med. 2007;175:661–666. 10.1164/rccm.200611-1717OC
6. Deng X, Ma J, Yuan Y, Zhang Z, Niu W. Association between overweight or obesity and the risk for childhood asthma and wheeze: an updated meta-analysis on 18 articles and 73 252 children. Pediatr Obes. 2019;14:e12532. 10.1111/ijpo.12532
7. Castro-Rodriguez JA, Holberg CJ, Morgan WJ, Wright AL, Martinez FD. Increased incidence of asthmalike symptoms in girls who become overweight or obese during the school years. Am J Respir Crit Care Med. 2001;163:1344–1349. 10.1164/ajrccm.163.6.2006140
8. Holguin F, Bleecker ER, Busse WW, Calhoun WJ, Castro M, Erzurum SC, et al. Obesity and asthma: an association modified by age of asthma onset. J Allergy Clin Immunol. 2011;127:1486–1493. 10.1016/j.jaci.2011.03.036
9. Dixon AE, Poynter ME. Mechanisms of asthma in obesity. Pleiotropic aspects of obesity produce distinct asthma phenotypes. Am J Respir Cell Mol Biol. 2016;54:601–608. 10.1165/rcmb.2016-0017PS
10. Peters U, Dixon AE, Forno E. Obesity and asthma. J Allergy Clin Immunol. 2018;141:1169–1179. 10.1016/j.jaci.2018.02.004
11. Boonpiyathad T, Sözener ZC, Satitsuksanoa P, Akdis CA. Immunologic mechanisms in asthma. Semin Immunol. 2019;46:101333. 10.1016/j.smim.2019.101333
12. Chawla A, Nguyen KD, Goh YP. Macrophage-mediated inflammation in metabolic disease. Nat Rev Immunol. 2011;11:738–749. 10.1038/nri3071
13. Weisberg SP, McCann D, Desai M, Rosenbaum M, Leibel RL, Ferrante AW Jr. Obesity is associated with macrophage accumulation in adipose tissue. J Clin Invest. 2003;112:1796–1808. 10.1172/JCI19246
14. Chehimi M, Vidal H, Eljaafari A. Pathogenic role of IL-17-producing immune cells in obesity, and related inflammatory diseases. J Clin Med. 2017;6.pii: E68. 10.3390/jcm6070068
15. Leiria LO, Martins MA, Saad MJ. Obesity and asthma: beyond Th2 inflammation. Metabolism. 2015;64:172–181. 10.1016/j.metabol.2014.10.002
16. Ouchi N, Parker JL, Lugus JJ, Walsh K. Adipokines in inflammation and metabolic disease. Nat Rev Immunol. 2011;11(2):85–97. 10.1038/nri2921
17. Quadro L, Blaner WS, Salchow DJ, Vogel S, Piantedosi R, Gouras P, et al. Impaired retinal function and vitamin A availability in mice lacking retinol-binding protein. EMBO J. 1999;18:4633–4644. 10.1093/emboj/18.17.4633
18. Huang F, Del-Río-Navarro BE, Leija-Martinez J, Torres-Alcantara S, Ruiz-Bedolla E, Hernández-Cadena L, et al. Effect of omega-3 fatty acids supplementation combined with lifestyle intervention on adipokines and biomarkers of endothelial dysfunction in obese adolescents with hypertriglyceridemia. J Nutr Biochem. 2019;64:162–169. 10.1016/j.jnutbio.2018.10.012
19. Park YH, Kim KW, Lee KE, Kim ES, Sohn MH, Kim KE. Clinical implications of serum retinol-binding protein 4 in asthmatic children. J Korean Med Sci. 2009;24:1010–1014. 10.3346/jkms.2009.24.6.1010
20. Huang F, Del-Río-Navarro BE, Torres-Alcántara S, Pérez-Ontiveros JA, Ruiz-Bedolla E, Saucedo-Ramírez OJ, et al. Adipokines, asymmetrical dimethylarginine, and pulmonary function in adolescents with asthma and obesity. J Asthma. 2017;54:153–161. 10.1080/02770903.2016.1200611
21. Klöting N, Graham TE, Berndt J, Kralisch S, Kovacs P, Wason CJ, et al. Serum retinol-binding protein is more highly expressed in visceral than in subcutaneous adipose tissue and is a marker of intra-abdominal fat mass. Cell Metab. 2007;6:79–87. 10.1016/j.cmet.2007.06.002
22. Periyalil HA, Wood LG, Wright TA, Karihaloo C, Starkey MR, Miu AS. Obese asthmatics are characterized by altered adipose tissue macrophage activation. Clin Exp Allergy. 2018;48:641–649. 10.1111/cea.13109
23. Shimomura I, Funahashi T, Takahashi M, Maeda K, Kotani K, Nakamura T, et al. Enhanced expression of PAI-1 in visceral fat: possible contributor to vascular disease in obesity. Nat Med. 1996;2:800–803. 10.1038/nm0796-800
24. Alessi MC, Bastelica D, Morange P, Berthet B, Leduc I, Verdier M, et al. Plasminogen activator inhibitor 1, transforming growth factor-beta1, and BMI are closely associated in human adipose tissue during morbid obesity. Diabetes. 2000;49:13741380. 10.2337/diabetes.49.8.1374
25. Busse WW, Lemanske RF Jr. Asthma. N Engl J Med. 2001;344:350–362. 10.1056/NEJM200102013440507
26. Cho SH, Ryu CH, Oh CK. Plasminogen activator inhibitor-1 in the pathogenesis of asthma. Exp Biol Med (Maywood). 2004;229:138–146. 10.1177/153537020422900202
27. Cho SH, Tam SW, Demissie-Sanders S, Filler SA, Oh CK. Production of plasminogen activator inhibitor-1 by human mast cells and its possible role in asthma. J Immunol. 2000;165:3154–3161. 10.4049/jimmunol.165.6.3154
28. Eitzman DT, McCoy RD, Zheng X, Fay WP, Shen T, Ginsburg D, et al. Bleomycin-induced pulmonary fibrosis in transgenic mice that either lack or overexpress the murine plasminogen activator inhibitor-1 gene. J Clin Invest. 1996;97:232–237. 10.1172/JCI118396
29. Oh CK, Ariue B, Alban RF, Shaw B, Cho SH. PAI-1 promotes extracellular matrix deposition in the airways of a murine asthma model. Biochem Biophys Res Commun. 2002;294:1155–1160. 10.1016/S0006-291X(02)00577-6
30. Swaisgood CM, Aronica MA, Swaidani S, Plow EF. Plasminogen is an important regulator in the pathogenesis of a murine model of asthma. Am J Respir Crit Care Med. 2007;176:333–342. 10.1164/rccm.200609-1345OC
31. Huang F, del-Río-Navarro BE, Alcántara ST, Ontiveros JA, Cienfuegos DR, Bello González SA, et al. Plasminogen activator inhibitor-1, fibrinogen, and lung function in adolescents with asthma and obesity. Endocr Res. 2012;37:135–144. 10.3109/07435800.2012.654555
32. Cho S, Kang J, Lyttle C, Harris K, Daley B, Grammer L, et al. Association of elevated plasminogen activator inhibitor 1 levels with diminished lung function in patients with asthma. Ann Allergy Asthma Immunol. 2011;106:371–377. 10.1016/j.anai.2010.12.021
33. De Taeye B, Smith LH, Vaughan DE. Plasminogen activator inhibitor-1: a common denominator in obesity, diabetes and cardiovascular disease. Curr Opin Pharmacol. 2005;5:149–154. 10.1016/j.coph.2005.01.007
34. Tashiro H, Shore SA. Obesity and severe asthma. Allergol Int. 2019;68:135–142. 10.1016/j.alit.2018.10.004
35. Sze E, Bhalla A, Nair P. Mechanisms and therapeutic strategies for non-T2 asthma. Allergy. 2020;75(2):311–325. 10.1111/all.13985
36. Yuan Y, Ran N, Xiong L, Wang G, Guan X, Wang Z, et al. Obesity-related asthma: immune regulation and potential targeted therapies. J Immunol Res. 2018;2018:1943497. 10.1155/2018/1943497
37. World Medical Association. World Medical Association Declaration of Helsinki: ethical principles for medical research involving human subjects. JAMA. 2013;310:2191–2194. 10.1001/jama.2013.281053
38. Kuczmarski RJ, Ogden CL, Guo SS, Grummer-Strawn LM, Flegal KM, Mei Z, et al. 2000 CDC Growth Charts for the United States: methods and development. Vital Health Stat 11. 2002;246:1–190.
39. Polgar G, Promadhat V. Standard values in pulmonary function testing in children: techniques and standards. Philadelphia, PA: Saunders; 1971.
40. Graham BL, Steenbruggen I, Miller MR, Barjaktarevic IZ, Cooper BG, Hall GL, et al. Standardization of spirometry 2019 Update. An Official American Thoracic Society and European Respiratory Society Technical Statement. Am J Respir Crit Care Med. 2019;200:e70–e88. 10.1164/rccm.201908-1590ST
41. Tanner JM. Growth at adolescence. Oxford, UK: Blackwell; 1962.
42. Youden WJ. Index for rating diagnostic tests. Cancer. 1950;3:32–35. 10.1002/1097-0142(1950)3:1<32::aid-cncr2820030106>3.0.co;2-3