
Download
ORIGINAL ARTICLE
Food allergy in adolescents: validation of the food allergy independent measure and the EuroPrevall food allergy quality of life questionnaire into Spanish
Dah-Tay Jang, Laura Ibáñez, Elisa Buendía, María Pérez Sabido, Bartoll Ester, Nieto María, Selva Blanca, Uixera Sonia, Nieto Antonio, Mazón Ángel*
Unit of Pediatric Allergy and Pneumology, Children’s Hospital Health Research Institute La Fe, Valencia, Spain
Abstract
Background: Different questionnaires have been developed globally to assess and compare the impact of food allergy on the quality of life. The aim of this study was to validate a Spanish translation of the Food Allergy Independent Measure (FAIM) and the EuroPrevall Food Allergy–Quality of Life Questionnaire–Teenage Form (FAQLQ-TF) for adolescents aged 13–17 years.
Methods: Sixty adolescents diagnosed with immunoglobulin E-mediated allergy to food completed the questionnaires. Cronbach’s alpha was used to assess internal consistency; correlation between FAQLQ-TF and FAIM was used to test construct validity. The discriminant validity was evaluated by comparison with the number of offending foods, the perceived impact on social life, the diagnosis of anaphylaxis, and the previous prescription of adrenaline auto--injectors (AAI).
Results: No question fulfilled criteria to be removed from the questionnaire. For FAIM, Cronbach’s alpha = 0.763, and for the four domains of FAQLQ-TF, Cronbach’s alpha = 0.797–0.847. A significant correlation existed between FAQLQ-TF and FAIM, and of both of them with anaphylaxis and the prescription of AAI (P ˂ 0.05 for all comparisons).
Conclusions: This Spanish translation of FAIM and FAQLQ-TF for adolescents had good internal consistency and construct validity as well as ability to discriminate patients according to the number of foods to avoid, impact on social life, diagnosis of anaphylaxis, and AAI prescription.
Key words: Adolescents, Food allergy, Quality of life, Questionnaire, Spanish, Teenagers, Validation
*Corresponding author: Angel Mazon. Unit of Pediatric Allergy and Pneumology. Hospital La Fe. Av. Fernando Abril Martorell 106. 46021-Valencia. Spain. Email address: [email protected]
Received 24 February 2022; Accepted 12 November 2022; Available online 1 March 2023
Copyright: Jang D-T, et al.
This open access article is licensed under Creative Commons Attribution 4.0 International (CC BY 4.0). http://creativecommons.org/licenses/by/4.0/
Introduction
High prevalence of food allergy has become a global challenge.1 Food allergy has a broad spectrum of severity, from minor sporadic symptoms to severe, life-threatening reactions. Thus, its impact on the quality of life (QoL) is variable, and, in addition to clinical reactions, costs and limitations in everyday life pose further challenges for children and their families.
Education of patients, food challenge tests, and recent procedures, such as desensitization or induction of oral tolerance, can have a favorable impact on QoL,2,3 although they are not always free of risks and can induce high direct and indirect costs.
The EuroPrevall initiative, with financial support from the Framework Programme FP6 of the European Union, had the objective of evaluating several aspects of food allergy in Europe, such as epidemiology, diagnosis, and treatment of food allergy.4 It developed some questionnaires on food allergy to assess and compare QoL across countries with the same tools. Specific questionnaires were developed for children, adolescents, and parents,5–7 which require to be translated and validated in different languages before use. The aim of our work was to validate into Spanish (Spain) the translation of the Food Allergy Independent Measure (FAIM) and the EuroPrevall Questionnaire on Food Allergy-Quality of Life Teenage Form (FAQLQ-TF) for adolescents aged 13–17 years.
Material and Methods
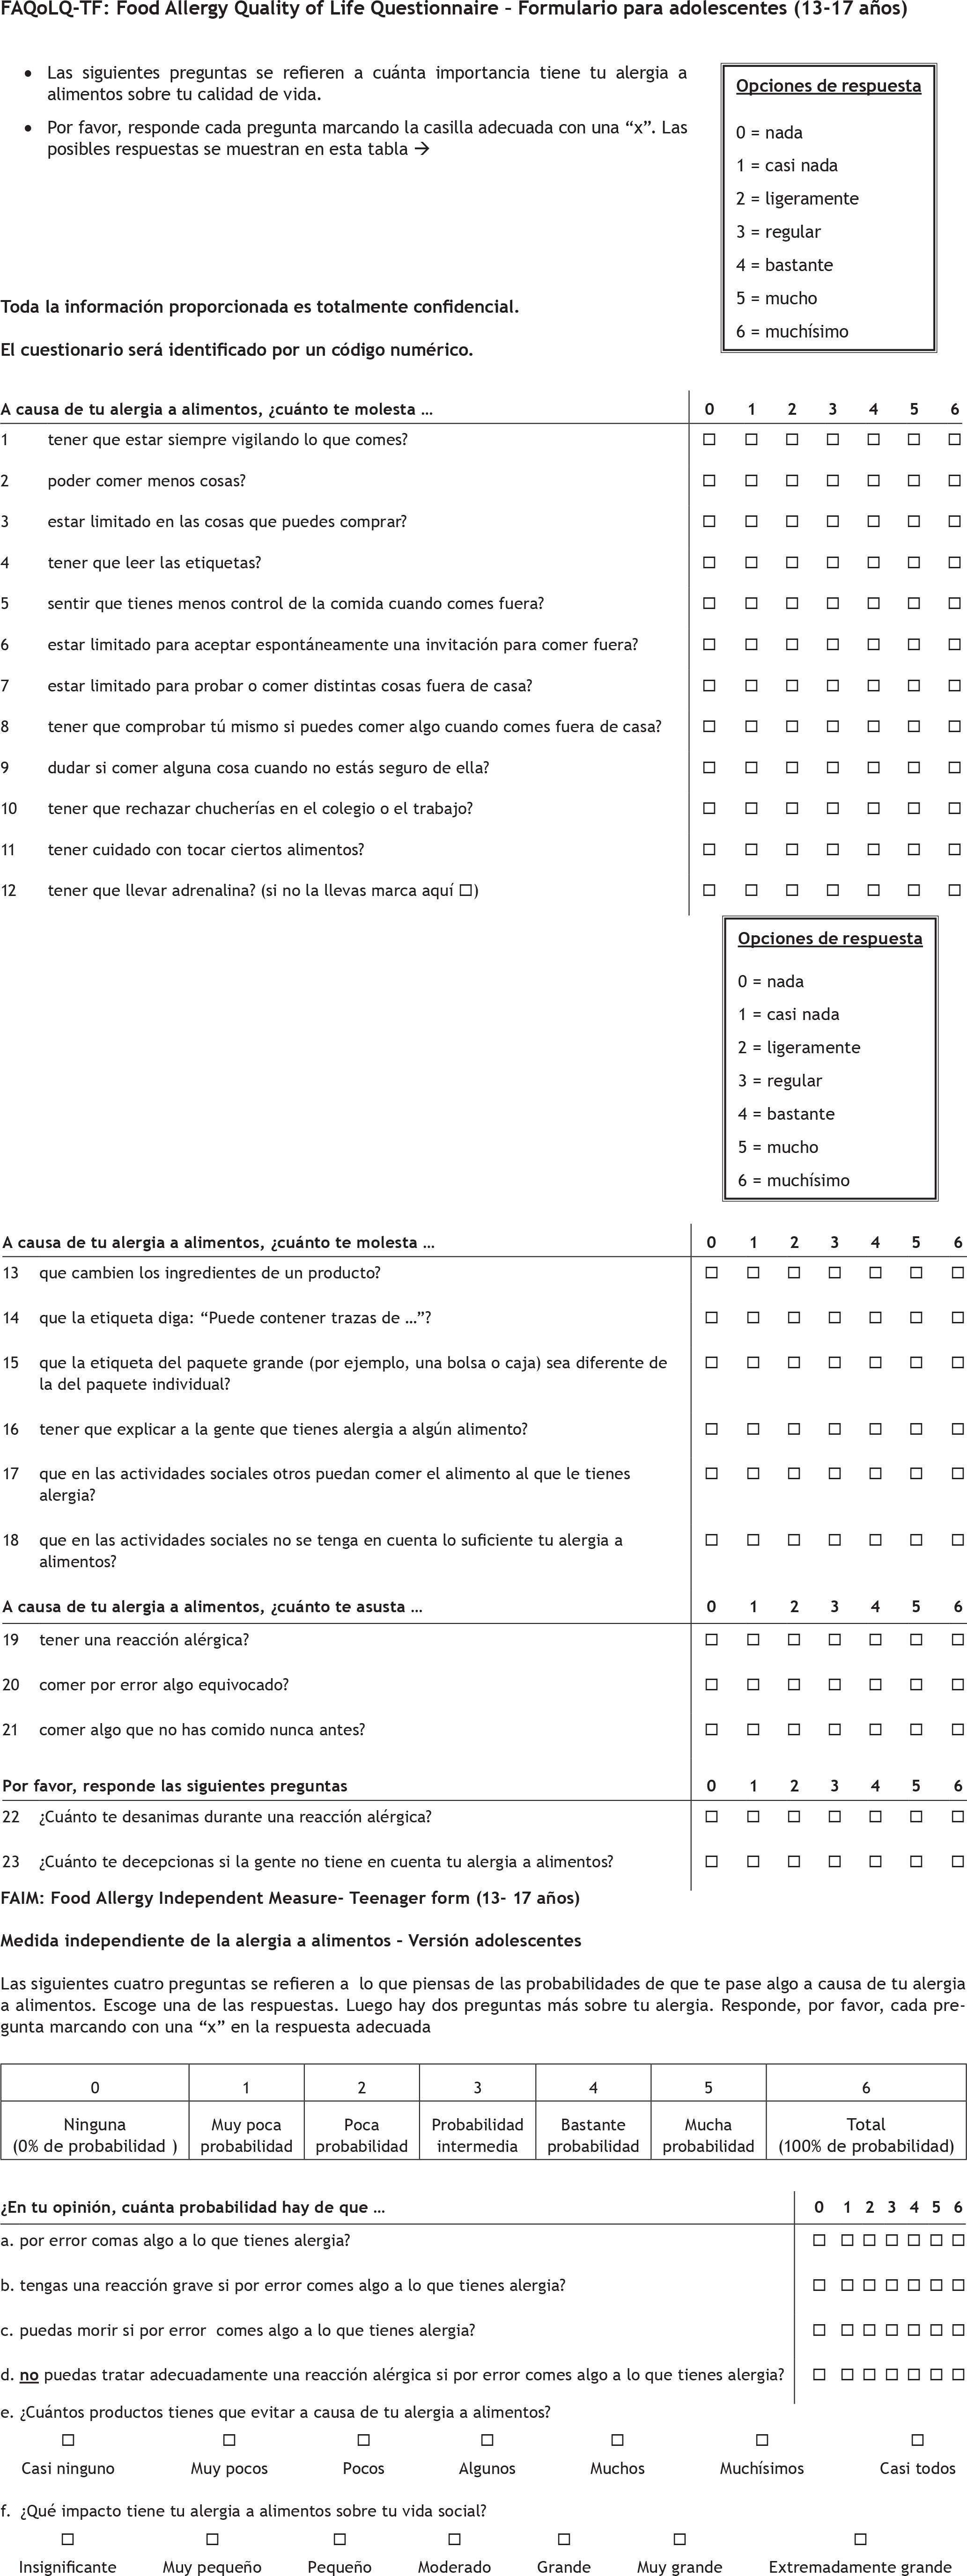
The English version of both FAQLQ-TF and FAIM6 were translated into Spanish following the same process as done before with the version of the questionnaires for children.8 Briefly, one of the authors, fluent in English and having over 20 years of experience in the evaluation of children and adolescents with food allergy, made the first translation, which was reviewed by other authors, to agree upon the final version. This was back-translated into English by an independent professional bilingual translator. The back-translated version was checked with the original one, and no relevant differences were found; hence, the agreed version was used for the study. A large pilot group of adolescents completed the questionnaires and could understand and answer all the questions (results not included), so the questionnaires were then used for the patients of this study. The translated versions are shown in the online Supplementary Figure S1.
Consecutive adolescents, 13–17-year old, filled in the questionnaires. They had immunoglobulin E (IgE)-mediated food allergy, based on compatible clinical manifestations, on the ingestion of food, together with positive skin prick test and/or serum-specific IgE. During one visit scheduled for a food challenge, before a reaction could occur, the adolescents filled in the questionnaire. For avoiding selection bias, they were invited to participate independent of severity of allergy or the number of offending foods.
The FAQLQ-TF had 23 questions in the following four domains: six questions on allergen avoidance, six on risk of accidental exposure, seven on emotional impact, and four on dietary restrictions.
The FAIM, used to evaluate the construct validity of questionnaires, has been shown to be relevant, reliable, and have face validity to independently measure food allergy.9 It includes four questions on expectation of outcome (EO), the perception of potential reactions after exposure to offending foods, and two questions on independent measures (IM), number of offending foods to avoid, and impact on social activities. The electronic records were reviewed to collect information about the diagnosis of anaphylaxis and the prescription of adrenaline auto-injectors (AAI). The study was approved by the Ethics Committee of the Health Research Institute La Fe (No. 2020-003-1), and results were coded to guarantee anonymity of responders.
The answers to the questions follow a Likert scale, ranging from 0 to 6, with higher values associated to worse QoL. The consistency of FAQLQ-TF domains and FAIM was assessed with Cronbach’s alpha. The corrected item-total correlations and changes in Cronbach’s alpha if an item was deleted were also estimated. The Spearman’s correlation value between the questions of FAQLQ-TF and those of FAIM was calculated. The Mann–Whitney U test was used to compare the values of FAQLQ-TF domains and FAIM depending on the diagnosis of anaphylaxis and previous prescription of AAI. SPSS 15.0, 2006 program (Chicago, Ill, USA) was used for calculations.
Results
Sixty adolescents completed the questionnaires. Their demographic and clinical data are shown in Table 1. They answered all the questions with no blank responses.
Table 1 Demographic and clinical description of participants; numbers (percentage).
| Gender | Male | 35 (58.3) | Age (mean and range) | 14.7 (13.0–17.2) |
| Female | 25 (41.7) | |||
| Age | ˂15 years | 36 (60) | Monoallergic | 17 (28.3) |
| ˃15 years | 24 (40) | Polyallergic | 43 (71.7) | |
| Asthma | No | 35 (58.3) | Foods | n |
| Yes | 25 (41.7) | Milk | 3 | |
| Anaphylaxis | Yes | 27 (45.0) | Egg | 11 |
| No | 33 (55.0) | Walnut | 32 | |
| Adrenaline | Yes | 26 (43.3) | Hazelnut | 23 |
| No | 34 (56.7) | Peanut | 20 | |
| Number of offending foods | 1 | 17 (28.3) | Cashew nut | 9 |
| 2 | 13 (21.7) | Pistachio | 11 | |
| 3 | 7 (11.7) | Kiwi | 19 | |
| 4 | 3 (5.0) | Peach | 25 | |
| 5 | 8 (13.3) | Fish | 9 | |
| 6 | 3 (5.0) | Crustaceans | 14 | |
| ˃6 | 9 (15.0) | Others | 52 |
Table 2 shows the values of Cronbach’s alpha (all values ˃0.7) for FAIM, FAQLQ-TF, and its four domains. Additional measures for each question of FAIM are also shown therein. Specific values for FAQLQ-TF domains are shown in Supplementary Tables S1–S4. If the corrected item-total correlation is less than 0.3, or if there is a substantial increase in the Cronbach’s alpha if an item is deleted, the removal of that question is generally recommended.10 This first criterion for removal was observed with FAIM question EO1 (“Chance that you will accidentally eat something to which you are allergic”) that had an item-total correlation value of 0.286. The second -criterion had no specific cut-off point, but if question 10 of FAQLQ-TF (“How troublesome do you find it, because of your food allergy, that you must refuse treats at school or work?”) was deleted, then there would be an increase in Cronbach’s alpha from 0.797 to 0.840. None of the rest of the questions met those criteria.
Table 2 Values of Cronbach’s alpha for the whole Food Allergy Quality of Life Questionnaire–Teenage Form (FAQLQ-TF) and its four domains, and the whole Food Allergy Independent Measure (FAIM) and its questions (EO1–EO4, IM1, and IM2).
| No. of questions | Cronbach’s alpha | Cronbach’s alpha if an item was deleted (range) | Corrected item/total correlation (range) | |
|---|---|---|---|---|
| Whole FAQLQ-TF | 23 | 0.937 | 0.931–0.937 | 0.443–0.779 |
| Allergen avoidance | 6 | 0.847 | 0.805–0.845 | 0.526–0.732 |
| Risk of accidental exposure | 6 | 0.802 | 0.720–0.796 | 0.441–0.763 |
| Emotional impact | 7 | 0.804 | 0.756–0.800 | 0.415–0.690 |
| Dietary restrictions | 4 | 0.797 | 0.702–0.840 | 0.449–0.706 |
| FAIM | 6 | 0.763 | 0.697–0.778 | 0.285–0.611 |
| EO1: Chance of accidental exposure | - | - | 0.778 | 0.285 |
| EO2: Chance of severe reaction | - | - | 0.715 | 0.551 |
| EO3: Chance of dying | - | - | 0.697 | 0.611 |
| EO4: Chance of not acting effectively | - | - | 0.739 | 0.459 |
| IM1: Number of foods to avoid | - | - | 0.713 | 0.580 |
| IM2: Effect on social life | - | - | 0.713 | 0.562 |
Significant correlations were observed between the whole FAQLQ-TF and its domains and the whole FAIM and its six questions (P ˂ 0.05). Further, significant correlations were also discovered when evaluating individual questions of FAQLQ-TF with those of FAIM (Table 3).
Table 3 Correlation (Spearman`s coefficient) of the Food Allergy Quality of Life Questionnaire–Teenage Form (FAQLQ-TF) score and its domains with the Food Allergy Independent Measure (FAIM) score and its questions.
| FAQLQ-TF | FAIM | ||||||
|---|---|---|---|---|---|---|---|
| Total | EO1 | EO2 | EO3 | EO4 | IM1 | IM2 | |
| Total | 0.734*** | 0.475*** | 0.502*** | 0.489*** | 0.417** | 0.674*** | 0.601*** |
| Allergen avoidance | 0.67*** | 0.61*** | 0.40** | 0.33* | 0.43** | 0.61*** | 0.52*** |
| 4 Read labels | 0.42** | 0.36** | 0.34** | 0.21 | 0.39** | 0.22 | 0.35** |
| 6 Stay for a meal | 0.63*** | 0.55*** | 0.38** | 0.31* | 0.37** | 0.60*** | 0.54*** |
| 7 Try fewer | 0.26* | 0.01 | 0.08 | 0.07 | 0.16 | 0.36** | 0.38** |
| 8 Check yourself | 0.56*** | 0.32* | 0.35** | 0.38** | 0.47*** | 0.45*** | 0.39** |
| 9 Hesitate eating | 0.53*** | 0.63*** | 0.39** | 0.20 | 0.31* | 0.39** | 0.30* |
| 16 Explain people | 0.26* | 0.40** | 0.03 | -0.06 | 0.15 | 0.33* | 0.27* |
| Risk of accidental exposure | 0.68*** | 0.45*** | 0.48*** | 0.45*** | 0.34** | 0.61*** | 0.54*** |
| 11 Touching foods | 0.45*** | 0.14 | 0.28* | 0.35** | 0.37** | 0.34** | 0.48*** |
| 13 Ingredients change | 0.64*** | 0.34** | 0.40** | 0.45*** | 0.27* | 0.65*** | 0.60*** |
| 14 Label traces of | 0.49*** | 0.42** | 0.42** | 0.31* | 0.16 | 0.40** | 0.29* |
| 15 Label different | 0.34** | 0.23 | 0.37** | 0.24 | 0.16 | 0.31* | 0.29* |
| 17 Others can eat | 0.41** | 0.33** | 0.13 | 0.20 | 0.20 | 0.44*** | 0.34** |
| 18 Not take account | 0.46*** | 0.42** | 0.40** | 0.30* | 0.25 | 0.34** | 0.29* |
| Emotional impact | 0.68*** | 0.30* | 0.61*** | 0.56*** | 0.38** | 0.56*** | 0.48*** |
| 5 Less control | 0.61*** | 0.41** | 0.46*** | 0.42** | 0.28* | 0.59*** | 0.43** |
| 12 Carry adrenaline | 0.43** | 0.16 | 0.33* | 0.44*** | 0.07 | 0.49*** | 0.33** |
| 19 Allergic reaction | 0.50*** | 0.12 | 0.62*** | 0.42** | 0.39** | 0.24* | 0.22 |
| 20 Eating wrong | 0.60*** | 0.26* | 0.63*** | 0.48*** | 0.39** | 0.27* | 0.32* |
| 21 Never before | 0.49*** | 0.31* | 0.40** | 0.36** | 0.33* | 0.48*** | 0.34** |
| 22 Discouraging reaction | 0.36** | 0.26* | 0.17 | 0.23 | 0.26* | 0.30* | 0.35** |
| 23 Not taking account | 0.33** | 0.01 | 0.37** | 0.34** | 0.20 | 0.23 | 0.33** |
| Dietary restriction | 0.65*** | 0.35** | 0.32* | 0.51*** | 0.36** | 0.65*** | 0.64*** |
| 1 Always watching | 0.58*** | 0.35** | 0.41** | 0.44*** | 0.27* | 0.46*** | 0.49*** |
| 2 Eating fewer things | 0.57*** | 0.14 | 0.27* | 0.45** | 0.35** | 0.62*** | 0.64*** |
| 3 Limited in buying | 0.60*** | 0.27* | 0.33* | 0.47*** | 0.51*** | 0.52*** | 0.56*** |
| 10 Refuse treats | 0.32** | 0.34** | 0.19 | 0.29* | 0.08 | 0.45*** | 0.39** |
Correlation is significant at *0.05, **0.01, and ***0.001 levels.
EO1: chance of accidental exposure; EO2: chance of severe reaction if exposed accidentally; EO3: chance of dying if exposed accidentally; EO4: chance of not acting effectively if exposed accidentally; IM1: number of foods one needs to avoid; IM2: effect of food allergy on social life.
The diagnosis of anaphylaxis and the fact of having been prescribed AAI (Table 4 and Supplementary Table S5) were associated with worse values of the whole FAQLQ-TF and its domains and whole FAIM and its six questions, except for having nearly significant association (P = 0.06) between the prescription of AAI and FAIM question EO4 (“Chance that you cannot effectively deal with an accidental allergic reaction”). Allergy to elemental foods, such as milk and eggs, had significantly worse QoL, and polyallergic patients had worse FAIM values than monoallergic patients (Table 4 and Supplementary Table S6); patient’s age or the presence of asthma was not significant (Table 4). A correlation was observed (P ˂ 0.001) between the values of FAQLQ-TF and its domains and the number of foods that patients felt they had to avoid (Supplementary Table S7). The time elapsed since the last reaction was not significant (P ˃ 0.26 for all questions).
Table 4 Mean rank values of the Food Allergy Quality of Life Questionnaire–Teenage Form (FAQLQ-TF) score and its domains, and Food Allergy Independent Measure (FAIM) score and its questions, according to the diagnosis of anaphylaxis and having been prescribed autoinjectable adrenaline.
| Whole FAQLQ-TF | FAIM | ||||||
|---|---|---|---|---|---|---|---|
| Mean rank | U | P | Mean rank | U | P | ||
| Anaphylaxis | No (n = 33) | 21.62 | 152 | ˂0.001 | 21.55 | 150 | ˂0.001 |
| Yes (n = 27) | 41.35 | 41.44 | |||||
| Adrenaline | No (n = 34) | 22.50 | 170 | ˂0.001 | 22.21 | 160 | ˂0.001 |
| Yes (n = 26) | 40.96 | 41.35 | |||||
| Age | ˂15 years (n = 36) | 29.58 | 399 | 0.618 | 31.03 | 384 | 0.73 |
| ≥15 years (n = 24) | 31.88 | 29.71 | |||||
| Asthma | No (n = 35) | 27.59 | 336 | 0.126 | 28.53 | 369 | 0.300 |
| Yes (n = 25) | 34.58 | 33.26 | |||||
| Monoallergic vs. polyallergic | Monoallergic (n = 17) | 24.68 | 266 | 0.104 | 22.50 | 229 | 0.025 |
| Polyallergic. (n = 43) | 32.80 | 33.66 | |||||
| Allergic to milk and/or eggs | No (n = 12) | 28.78 | 182 | 0.049 | 28.44 | 219 | 0.201 |
| Yes (n = 48) | 39.38 | 38.75 | |||||
| Allergic to nuts | No (n = 20) | 25.23 | 295 | 0.098 | 25.28 | 347 | 0.405 |
| Yes (n = 40) | 33.14 | 33.11 | |||||
There was no floor or ceiling effect: none of the patients had the lowest score in the whole FAQLQ-TF and its domains and FAIM and its questions. Only one patient (1.7%) had the highest score for the domain of allergen avoidance, and another patient in FAIM well below the acceptable proportion of 15%.11
Discussion
Validation of common questionnaires in different languages is important to compare food allergy across the world. Versions of questionnaires for children aged 8–12 years and for parents have been already validated in Spanish and other languages.8,12,13 Nevertheless, validation of FAQLQ-TF or other questionnaires14 for adolescents was practically nonexistent in languages other than English, even though adolescents have frequent reactions,15 which impact their QoL. In this study, we aimed to validate FAQLQ-TF and FAIM for adolescents in Spanish.
Values of Cronbach’s alpha for the whole FAQLQ-TF and its four domains were more than 0.79 (values above 0.70 are considered acceptable).16 Likewise, Cronbach’s alpha for FAIM was 0.763. These results demonstrated a good global internal consistency.
Nevertheless, if the question on accepting treats at school or work place was deleted, then Cronbach’s alpha for the domain of dietary restrictions showed a moderate increase from 0.797 to 0.840. The fact that our study was conducted during the COVID-19 pandemic must have affected this domain, as sharing treats at school or work place was prohibited since the beginning of the outbreak; although, this limitation on treats is probably not as important in adolescents as in younger children. One of the FAIM questions (EO1: “Chance of accidental reaction”) showed a corrected item-total correlation of 0.285, intending a low correlation of this question with the summated scores of other questions in FAIM. If the values are less than 0.3 or even 0.4,10 then the removal of the question should be considered, as it may not be measuring the same entity as the others.
The correlation of FAQLQ-TF with independent FAIM was assessed to evaluate the construct validity of the questionnaire.9 We discovered significant correlations between the global scores and the scores of FAQLQ-TF domains. Most, but not all, of the correlations between individual questions of FAQLQ-TF and FAIM questions were significant. While FAIM mostly reflects the severity of food allergy, some of the questions in FAQLQ-TF reflect impact on everyday QoL, and there may be no correlations, as we also found, to a greater extent, in the questionnaires for children aged 8–12 years.8
The discriminant capacity was assessed through several variables. In the validation of both our version and the English version, adolescents who had to avoid more foods demonstrated worse scores in questionnaires.6 We found worse scores for both FAQLQ-TF and FAIM in children with anaphylaxis or having previous prescription of adrenaline. In the validation of the English version, FAQLQ-TF was not able to discriminate between patients with and without anaphylaxis.6 In our case, this association was clear for global scores as well as for all the questions of FAIM; however, it had not been so clear in the questionnaires for children aged 8–12 years,8 may be because of less maturity to understand the consequences of food allergy. Allergy to basic foods, such as milk and eggs, was associated with worse QoL, and polyallergy was linked to worse FAIM; however, these variables did not indicate the same consistency as anaphylaxis or adrenaline prescription. In fact, their significance was mainly driven by only one or two individual questions, and not by all of them as for anaphylaxis or adrenaline prescription.
No ceilings or floor effects were found for questionnaires and domains.11 This finding, together with the significant differences according to anaphylaxis, prescription of adrenaline and number of foods to avoid, support the discriminant ability of the Spanish version.
Some limitations of our study were common with validation in children aged 8–12 yeas.8 We did not perform a comparison of FAQLQ-TF with generic health-related QoL questionnaires. Specific questionnaires are more adequate to evaluate changes in QoL because of food allergy,17,18 and a low agreement has been described between specific and generic questionnaires,18,19 which are recommended, instead, to compare different disorders.17,18 The test-retest reliability was not evaluated either, as the food challenge performed on the day when questionnaires were completed could induce a relevant change in QoL. This potential change on the stability of patient’s condition could invalidate results of the retest. However, excellent reliability has been established for the English version of FAQLQ-TF.6,20
Conclusion
In summary, the Spanish version of both FAQLQ-TF and FAIM has shown good values regarding internal consistency, construct validity, and acceptable discriminant capacity for some clinical variables. Although it has some limitations and some questions require further evaluation, it can be used as a validated questionnaire for QoL in adolescents with food allergy similar to other language versions until better tools are designed.
REFERENCES
1. Lyons SA, Clausen M, Knulst AC, Ballmer-Weber BK, Fernandez-Rivas M, Barreales L, et al. Prevalence of food sensitization and food allergy in children across Europe. J Allergy Clin Immunol Pract. 2020 Sep;8(8):2736–46.e9. 10.1016/j.jaip.2020.04.020
2. Kansen HM, Le TM, Meijer Y, Flokstra-de Blok BMJ, Welsing PMJ, van der Ent CK, et al. The impact of oral food challenges for food allergy on quality of life: A systematic review. Pediatr Allergy Immunol. 2018;29(5):527–37. 10.1111/pai.12905
3. Cao S, Borro M, Alonzi S, Sindher S, Nadeau K, Chinthrajah RS. Improvement in health-related quality of life in food-allergic patients: A meta-analysis. J Allergy Clin Immunol Pract. 2021 Oct;9(10):3705–14. 10.1016/j.jaip.2021.05.020
4. De Blok BM, Vlieg-Boerstra BJ, Oude Elberink JN, Duiverman EJ, DunnGalvin A, Hourihane JO, et al. A framework for measuring the social impact of food allergy across Europe: A EuroPrevall state of the art paper. Allergy. 2007 Jul;62(7):733–7. 10.1111/j.1398-9995.2006.01303.x
5. Flokstra-de Blok BM, DunnGalvin A, Vlieg-Boerstra BJ, Oude Elberink JN, Duiverman EJ, Hourihane JO, et al. Development and validation of a self-administered Food Allergy Quality of Life Questionnaire for children. Clin Exp Allergy. 2009 Jan;39(1): 127–37. 10.1111/j.1365-2222.2008.03120.x
6. Flokstra-de Blok BM, DunnGalvin A, Vlieg-Boerstra BJ, Oude Elberink JN, Duiverman EJ, Hourihane JO, et al. Development and validation of the self-administered Food Allergy Quality of Life Questionnaire for adolescents. J Allergy Clin Immunol. 2008 Jul;122(1):139–44, 144.e1-2. 10.1016/j.jaci.2008.05.008
7. DunnGalvin A, de BlokFlokstra BM, Burks AW, Dubois AE, Hourihane JO. Food allergy QoL questionnaire for children aged 0–12 years: Content, construct, and cross-cultural validity. Clin Exp Allergy. 2008 Jun;38(6):977–86. 10.1111/j.1365-2222.2008.02978.x
8. Jang DT, Sabido MP, Buendía E, Ibáñez L, Nieto M, Bartoll E, et al. Validation of the food allergy independent measure and the EuroPrevall food allergy quality of life questionnaire for children 8–12 years translated into Spanish. Allergol Immunopathol (Madr). 2022 Jan 1;50(1):51–9. 10.15586/aei.v50i1.467
9. van der Velde JL, Flokstra-de Blok BM, Vlieg-Boerstra BJ, Oude Elberink JN, DunnGalvin A, Hourihane JO, et al. Development, validity and reliability of the food allergy independent measure (FAIM). Allergy. 2010 May;65(5):630–5. 10.1111/j.1398-9995.2009.02216.x
10. Gliem JA., Gliem RR. Calculating, interpreting, and reporting Cronbach’s alpha reliability coefficient for Likert-type scales. 2003 Midwest Research to Practice Conference in Adult, Continuing, and Community Education, Ohio State University, Columbus, OH [Internet]. [cited 2003]. Available from: https://scholarworks.iupui.edu/bitstream/handle/1805/344/Gliem+&+Gliem.pdf?sequence=1 Accessed March 10, 2022.
11. Terwee CB, Bot SD, de Boer MR, van der Windt DA, Knol DL, Dekker J, et al. Quality criteria were proposed for measurement properties of health status questionnaires. J Clin Epidemiol. 2007 Jan;60(1):34–42. 10.1016/j.jclinepi.2006.03.012
12. Bartoll E, Nieto M, Selva B, Badillo R, Pereira G, Uixera S, et al. Validation of a Spanish version of the EuroPrevall Food Allergy Quality of Life Questionnaire--Parental Form. Allergol Immunopathol (Madr). 2018 Jan–Feb;46(1):82–6. 10.1016/j.aller.2017.06.004
13. Manso L, Pineda R, Huertas B, Fernández-Rivas M, Diéguez MC, Cerecedo I, et al. Validation of the Spanish version of the Food Allergy Quality of Life Questionnaire--Parent Form (S-FAQLQ-PF). J Investig Allergol Clin Immunol. 2017;27(6):363–9. 10.18176/jiaci.0182
14. Resnick ES, Pieretti MM, Maloney J, Noone S, Muñoz-Furlong A, Sicherer SH. Development of a questionnaire to measure quality of life in adolescents with food allergy: The FAQL-teen. Ann Allergy Asthma Immunol. 2010 Nov;105(5):364–8. 10.1016/j.anai.2010.09.006
15. McWilliam VL, Koplin JJ, Field MJ, Sasaki M, Dharmage SC, Tang MLK, et al. SchoolNuts investigators. Self-reported adverse food reactions and anaphylaxis in the SchoolNuts study: A population-based study of adolescents. J Allergy Clin Immunol. 2018 Mar 141(3):982–90. 10.1016/j.jaci.2017.09.012
16. Tavakol M, Dennick R. Making sense of Cronbach’s alpha. Int J Med Educ. 2011;2:53–5. 10.5116/ijme.4dfb.8dfd
17. Salvilla SA, Dubois AE, Flokstra-de Blok BM, Panesar SS, Worth A, Patel S, et al. Disease-specific health-related quality of life instruments for IgE-mediated food allergy. Allergy. 2014 Jul;69(7):834–44. 10.1111/all.12427.
18. Flokstra-de Blok BM, Dubois AE, Vlieg-Boerstra BJ, Oude Elberink JN, Raat H, DunnGalvin A, et al. Health-related quality of life of food allergic patients: Comparison with the general population and other diseases. Allergy. 2010 Feb;65(2):238–44. 10.1111/all.12427
19. Mizuno Y, Ohya Y, Nagao M, DunnGalvin A, Fujisawa T. Validation and reliability of the Japanese version of the Food Allergy Quality of Life Questionnaire-Parent Form. Allergol Int. 2017 Apr;66(2):290–5. 10.1016/j.alit.2016.06.013
20. Van Der Velde JL, Flokstra-De Blok BMJ, Vlieg-Boerstra BJ, Oude Elberink JNG, Schouten JP, Dunngalvin A, et al. Test-retest reliability of the Food Allergy Quality of Life Questionnaires (FAQLQ) for children, adolescents and adults. Qual Life Res. 2009;18(2):245–51. 10.1007/s11136-008-9434-2
Supplementary
Figure S1 Cuestionario de Calidad de Vida en Alergia Alimentaria—Formulario para adolescentes (13–17 años).
Table S1 Modifications in Cronbach’s alpha for each question in the domain of allergen avoidance (Cronbach’s alpha = 0.847).
| Cronbach’s alpha when an item was deleted | Corrected item/total correlation | |
|---|---|---|
| 4 Read labels | 0.842 | 0.526 |
| 6 Stay for a meal | 0.817 | 0.658 |
| 7 Try fewer | 0.805 | 0.718 |
| 8 Check yourself | 0.819 | 0.656 |
| 9 Hesitate eating | 0.805 | 0.732 |
| 16 Explain people | 0.845 | 0.527 |
Table S2 Modifications in Cronbach’s alpha for each question in the domain of risk of accidental exposure (Cronbach’s alpha = 0.802).
| Cronbach’s alpha when an item was deleted | Corrected item/total correlation | |
|---|---|---|
| 11 Touching foods | 0.779 | 0.521 |
| 13 Ingredients change | 0.720 | 0.763 |
| 14 Label traces of | 0.770 | 0.565 |
| 15 Label different | 0.766 | 0.580 |
| 17 Others can eat | 0.796 | 0.441 |
| 18 Not take account | 0.787 | 0.483 |
Table S3 Modifications in Cronbach’s alpha for each question in the domain of emotional impact (Cronbach’s alpha = 0.804).
| Cronbach’s alpha when an item was deleted | Corrected item/total correlation | |
|---|---|---|
| 5 Less control | 0.776 | 0.550 |
| 12 Carry epipen | 0.799 | 0.460 |
| 19 Allergic reaction | 0.761 | 0.643 |
| 20 Eating wrong | 0.756 | 0.690 |
| 21 Never before | 0.756 | 0.666 |
| 22 Discouraged reaction | 0.799 | 0.415 |
| 23 Not taking account | 0.800 | 0.418 |
Table S4 Modifications in Cronbach’s alpha for each question in the domain of dietary restriction (Cronbach’s alpha = 0.797).
| Cronbach’s alpha when an item was deleted | Corrected item/total correlation | |
|---|---|---|
| 1 Always watching | 0.710 | 0.682 |
| 2 Eating fewer things | 0.731 | 0.644 |
| 3 Limited in buying | 0.702 | 0.706 |
| 10 Refuse treats | 0.840 | 0.449 |
Table S5 Mean rank of values of the Food Allergy Quality of Life Questionnaire–Teenage Form (FAQLQ-TF) score and domains, and Food Allergy Independent Measure (FAIM) score and questions according to the diagnosis of anaphylaxis and the previous prescription of autoinjectable adrenaline.
| Anaphylaxis | Autoinjectable adrenaline | |||||||
|---|---|---|---|---|---|---|---|---|
| No (n = 33) | Yes (n = 27) | U | P | No (n = 34) | Yes (n = 26) | U | P | |
| Whole FAQLQ-TF | 21.62 | 41.35 | 152 | ˂0.001 | 22.50 | 40.96 | 170 | ˂0.001 |
| Allergen avoidance | 23.58 | 38.96 | 217 | 0.001 | 23.94 | 39.08 | 219 | 0.001 |
| Risk of accidents | 22.26 | 40.57 | 173 | ˂0.001 | 23.24 | 40.00 | 195 | ˂0.001 |
| Emotional impact | 21.48 | 41.52 | 148 | ˂0.001 | 22.10 | 41.48 | 156 | ˂0.001 |
| Dietary restrictions | 22.86 | 39.83 | 193 | ˂0.001 | 23.91 | 39.12 | 218 | 0.001 |
| FAIM | 21.55 | 41.44 | 150 | ˂0.001 | 22.21 | 41.35 | 160 | ˂0.001 |
| EO1: Chance of accidental exposure | 26.17 | 35.80 | 302 | 0.029 | 25.79 | 36.65 | 282 | 0.014 |
| EO2: Chance of severe reaction | 23.18 | 39.44 | 204 | ˂0.001 | 24.00 | 39.00 | 221 | 0.001 |
| EO3: Chance of dying | 22.12 | 40.74 | 169 | ˂0.001 | 22.96 | 40.37 | 185 | ˂0.001 |
| EO4: Chance of not acting effectively | 26.11 | 35.87 | 300 | 0.028 | 26.87 | 35.25 | 318 | 0.060 |
| IM1: Number of foods to avoid | 23.91 | 38.56 | 228 | 0.001 | 23.69 | 39.40 | 210 | ˂0.001 |
| IM2: Effect on social life | 24.29 | 38.09 | 240 | 0.002 | 24.71 | 38.08 | 245 | 0.002 |
Table S6 Mean rank of values of the Food Allergy Quality of Life Questionnaire–Teenage Form (FAQLQ-TF) score and its domains, and Food Allergy Independent Measure (FAIM) score and its questions according to polyallergy and allergy to milk and eggs.
| Allergy to milk and/or eggs | Polyallergic | |||||||
|---|---|---|---|---|---|---|---|---|
| No (n = 48) | Yes (n = 12) | U | P | No (n = 34) | Yes (n = 26) | U | P | |
| Whole FAQLQ-TF | 28.28 | 39.38 | 182 | 0.049 | 26.48 | 32.80 | 267 | 0.104 |
| Allergen avoidance | 27.92 | 40.83 | 164 | 0.022 | 26.03 | 32.27 | 290 | 0.212 |
| Risk of accidents | 29.04 | 36.33 | 218 | 0.195 | 26.53 | 32.07 | 293 | 0.268 |
| Emotional impact | 28.74 | 37.54 | 203 | 0.118 | 25.79 | 32.36 | 286 | 0.189 |
| Dietary restrictions | 27.43 | 42.79 | 140 | 0.006 | 23.82 | 33.14 | 252 | 0.062 |
| FAIM | 28.44 | 38.75 | 189 | 0.067 | 22.50 | 33.66 | 230 | 0.025 |
| EO1: Chance of accidental exposure | 28.26 | 39.46 | 181 | 0.041 | 32.26 | 29.80 | 336 | 0.612 |
| EO2: Chance of severe reaction | 29.45 | 34.71 | 238 | 0.343 | 26.53 | 32.07 | 298 | 0.261 |
| EO3: Chance of dying | 29.04 | 36.33 | 218 | 0.186 | 24.85 | 32.73 | 270 | 0.108 |
| EO4: Chance of not acting effectively | 30.24 | 31.54 | 275 | 0.814 | 27.32 | 31.76 | 312 | 0.366 |
| IM1: Number of foods to avoid | 27.94 | 40.75 | 165 | 0.019 | 20.41 | 34.49 | 194 | 0.004 |
| IM2: Effect on social life | 27.38 | 43.00 | 138 | 0.004 | 18.71 | 35.16 | 165 | 0.001 |
Table S7 Spearman’s correlation of the values of FAQLQ-TF and its domains with the number of foods to avoid (P ˂ 0.001 in all cases).
| Whole FAQLQ-TF | Allergen avoidance | Risk of accidental exposure | Emotional impact | Dietary restriction | |
|---|---|---|---|---|---|
| Number of foods to avoid | 0.674 | 0.647 | 0.607 | 0.555 | 0.614 |