
Download
ORIGINAL ARTICLE
Association between allergen component sensitisation and clinical allergic disease in children
Paul L.P. Branda, b, Richard M. Brohetc, Olof Schwantjed, Lambert D. Dikkescheie*
aIsala Academy, Department of Medical Education and Faculty Development, Isala Hospital, Zwolle, The Netherlands
bWenckebach Institute for Medical Education, University Medical Centre, Groningen, The Netherlands
cIsala Academy, Department of Research and Innovation, Isala Hospital, Zwolle, The Netherlands
dGeneral Practice Schwantje & Groot, Zwolle, The Netherlands
eCentral Laboratory, Isala Hospital, Zwolle, The Netherlands
Abstract
Background Allergen component sensitisation testing is becoming increasingly important in the diagnosis of peanut allergy. The aim of the present study was to evaluate the relationship between sensitisation and symptoms of allergic disease in children by testing a large panel of inhalants, food allergens, and allergen components.
Methods For 287 children visiting our laboratory for allergy testing, symptoms of allergic disease were recorded by standardised validated questionnaires. Specific IgE to 11 whole allergens was assessed by ImmunoCAP, and to 112 allergen components by ISAC ImmunoCAP assay. We used latent class analysis (LCA) to distinguish clinical phenotypes.
Results Inhalant and food allergen sensitisation was common, irrespective of the children’s allergic symptom type. Less than 10% of the variance in symptom scores was explained by variations in the number of allergens (components) that the child was sensitised to. In LCA, 135 children (50.2%) had mild allergy, with few symptoms and sensitisation to no or few allergens, 74 children (27.5%) had more symptoms and sensitisation to inhalant allergens (respiratory allergy) and 60 children (22.3%) showed polysensitisation to a median of six allergens and had more severe symptoms of different organ systems. Adding allergen component test results to LCA failed to result in identifiable classes of allergic disease in children.
Conclusions In this group of children with allergic symptoms, referred for allergy testing by their physician, broad screening for allergen component sensitisation did not contribute to distinguishing phenotypes of allergic disease.
Key words: allergen component sensitisation, children, allergy, component-resolved diagnostics, IgE, sensitisation, specific IgE
*Corresponding author: Paul L.P. Brand, Isala Academy, Department of Medical Education and Faculty Development, Isala Hospital, PO Box 10400, 8000 GK Zwolle, The Netherlands. Email address: [email protected]
Received 6 February 2022; Accepted 17 February 2022; Available online 1 March 2022
Copyright: Brand Paul LP, et al.
License: This open access article is licensed under Creative Commons Attribution 4.0 International (CC BY 4.0). http://creativecommons.org/licenses/by/4.0/
Introduction
The diagnosis of clinical allergy in children relies on the combination of a history of symptoms suggestive of allergy and the demonstration of sensitisation to the suspected allergen by skin prick or specific IgE testing.1,2 Although a convincing structured history plays a key part in the diagnostic work-up of both food and inhalant allergens, a symptom history alone carries a high risk of false positive and negative results.3,4 Similarly, allergen sensitisation alone is insufficient to diagnose clinically relevant allergies.1,2,5 The main problem with allergen sensitisation tests is their excessive sensitivity, resulting in a high degree of false positives.1,2
Component-resolved diagnostics (CRDs), that is, testing of sensitisation to specific allergen components instead of testing of sensitisation to the whole allergen, may improve the relationship between sensitisation and clinical allergies in children.6 For example, after initial reports indicated that sensitisation to the component Arah2 was associated with a high risk of clinically relevant peanut allergy in children,7 the diagnostic value of assessing sensitisation to peanut allergen components in the diagnostic work up of suspected peanut allergy in children became increasingly clear.8 Investigations have also begun to explore the relationship between allergen component sensitisation and clinical allergy for other allergens, including pets and hen’s egg,9,10 to help in unravelling complex or rare allergies,11 aid in decisions regarding specific allergen immunotherapy12 and predict the risk and severity of asthma.10,13 To date, Ara h2 testing in suspected peanut allergy is the allergen component test that has been most implemented in paediatric clinical allergy practice.8 Although a few population-based studies have used CRDs in a wide range of allergen components to examine the risk of (developing) allergies over time,13–15 there is a lack of studies on the relationship between CRD results and allergy symptoms in groups of patients with suspected allergies. Results of such studies may help clinicians to appreciate the potential value of CRD testing in their diagnostic approach to allergies in childhood.
The aim of the present study was to evaluate the relationship of CRDs and the clinical expression of common allergic diseases in children.
Materials and Methods
Design
This was a prospective cohort study of children, 0–18 years of age, for whom the general practitioner (GP) or hospital-based paediatrician ordered a specific IgE test at Isala’s Central Laboratory in Zwolle, the Netherlands. This laboratory performs an average of 1000 specific IgE tests in children annually.16
Participants
From January 2015 to December 2017, parents/guardians of each child referred to the laboratory for allergy testing were asked to participate in the study and to allow for obtaining an additional 5 mL serum sample for study purposes. This did not require additional venipuncture.
Symptom questionnaires
Guided by their responses to a research assistant’s question about the nature of their child’s allergic symptoms, parents were asked to complete one or more of the following validated symptom questionnaires electronically, links for which were emailed to them by the research assistant: the Children's Dermatology Life Quality Index (CDLQI) to assess atopic dermatitis symptoms,17 the paediatric Rhinoconjunctivitis Quality of Life Questionnaire (RQLQ) to assess allergic rhinitis symptoms,18 the paediatric Asthma Control Questionnaire (ACQ) to assess asthma symptoms19 and the food allergy quality of life questionnaire (FAQLQ) to assess food allergy symptoms.20 Children aged 8 years or older completed the corresponding child versions of the questionnaires, aided by their parents. The CDLQI score ranges from 0 to 30, and the RQLQ, ACQ and FAQLQ from 0 to 6. Higher scores indicate more severe symptoms.
Parents also completed a generic paediatric quality of life questionnaire (the Quality of My Life (QML) questionnaire).21 QML is recorded on a visual analogue scale ranging from 0 (poorest) to 100 (best quality of life).
Specific IgE testing
As described in more detail previously,16,22 blood samples were investigated using a screening test for aeroallergens, food allergens, or both (Phadiatop, FX5 or Phadiatop infant, Thermo Fisher, Uppsala, Sweden). In the case of a positive screening test, specific IgE to a panel of common aeroallergens (house dust mite, cat dander, dog dander, grass pollen and tree pollen) and food allergens (cow’s milk, hen’s egg, peanut, tree nuts, wheat and soy) was assessed using the ImmunoCAP system (Thermo Fisher, Uppsala, Sweden). A specific IgE level of 0.35 kU/L or greater was considered to reflect sensitisation to the specific allergen.
Component-resolved diagnostics
The additional 5 mL serum sample was used to assess IgE to 112 allergenic molecules (components) using ImmunoCAP ISAC (ThermoFisher/Phadia AB, Uppsala, Sweden). In this assay, allergen components that are immobilized on a solid substrate in a microarray format react with the specific IgE in the patient sample. After washing away non-specific IgE, fluorescence-labelled anti-human IgE antibody is added to form a complex, and unbound fluorescence-labelled anti-human IgE antibodies are removed by washing. The procedure is followed by fluorescence measurement using a LuxScan 10k Microarray Scanner, and the results are expressed as ISU-E. The assay has demonstrated excellent reproducibility between laboratories.23
Statistical analysis
Standard statistical techniques were applied to examine the relationship between allergic symptoms (as assessed by standardised questionnaires), whole allergen sensitisation and CRD results. In addition, latent class analysis (LCA) was performed to find patient groups with clinically distinct profiles of allergic symptoms and patterns of sensitisation to either whole allergens or allergen components (CRDs).24 A maximum likelihood method was used to estimate patterns in patient characteristics summarised into groups or latent classes by providing a probability distribution over the cluster assignment for each patient. We compared models, allowing for different numbers of latent classes. We used likelihood ratios, Akaike’s information criterion (AIC) and Bayesian information criterion (BIC) to compare the models, with smaller AIC and BIC values indicating better models in terms of parsimoniousness next to the goodness-of-fit estimate.
Data were analysed using SPSS Statistics version 24.0 and with STATA version 16.1 (Statacorp LLC) for LCA. In light of the exploratory nature of the study, we refrained from adjusting for multiple comparisons.
Ethics
This study was approved by Isala Hospital’s Ethical Review Board (file number: 13.11128).
Results
From the 767 children approached for participation in the study, completed symptom questionnaires were obtained from 464 children (61%) (256 boys, 55%). These children had symptoms of allergic rhinitis (n=301, 65%), asthma (n=239, 52%), eczema (n=117,25%) or (suspected) food allergy (n=129, 28%), and 23 (5%) had other non-specific symptoms (such as malaise or abdominal pain). Mean age was 7.9 (5.0) years.
Permission to obtain additional serum for CRDs was obtained from parents of 287 patients (149 boys, 52%). Demographic and symptomatic characteristics of these children are presented in Table 1. There were no statistically significant differences in age, gender, or type of symptoms among children with or without CRD analysis (all P values > 0.1).
Table 1 Age and gender of the 287 study participants for whom completed symptom questionnaires and component resolved diagnostics data were available and for those with different types of allergic symptoms.
| Mean (SD) age | Male gender, number (%) | Median (range) of symptom questionnaire | |
|---|---|---|---|
| Asthma (n=111) | 7.9 (4.8) | 64 (58%) | ACQ median 0.9 (0–5.6) |
| Allergic rhinitis (n=170) | 9.2 (5.2) | 96 (56%) | RQLQ median 0.3 (0–6) |
| Atopic dermatitis (n=64) | 7.7 (4.3) | 32 (50%) | CDLQI median 0.3 (0–17) |
| (Suspected) food allergy (n=68) | 6.4 (4.5) | 36 (53%) | FAQLQ median 0.6 (0–3.0) |
| Non-specific symptoms (n=26) | 7.5 (4.7) | 17 (65%) | |
| Overall | 8.0 (5.0) | 149 (52%) | QML median 91 (29–100) |
ACQ, asthma control questionnaire; RQLQ, rhinitis quality of life questionnaire; CDLQI, children’s dermatology life quality index; FAQLQ, food allergy quality of life questionnaire; QML, quality of my life questionnaire.
Overall, 208 children (72.5%) were sensitised to one or more inhalant allergens (house dust mite, dog dander, cat dander, grass pollen or tree pollen), 92 (32.1%) to one or more food allergens (cow’s milk, hen’s egg, peanut, tree nuts, soy or wheat) and 86 (30.0%) to one or more inhalant and one or more food allergens. The median (interquartile range) number of children sensitised to whole allergens was 2 (2–5).
Supplementary Table A lists the number of children sensitised to each of the allergen components in the ISAC ImmunoCAP assay, and the median and range of the degree of sensitisation (in ISU-E) for each component.
The relationship of whole allergen sensitisation to the type of allergic symptoms is presented in Table 2. Sensitisation to inhalant allergens occurred in 73%, 76%, 84% and 71% of children with asthma, allergic rhinitis, atopic dermatitis and food allergy, respectively. Sensitisation to food allergens was found in 34%, 34%, 50% and 40% of children with asthma, allergic rhinitis, atopic dermatitis and food allergy, respectively.
Table 2 Relationship between whole allergen sensitisation and the type of allergic symptoms (n=287).
| Hay fever (n = 170) |
Asthma (n = 111) |
Eczema (n = 64) |
(Suspected) food allergy (n = 68) |
Non-specific symptoms (n = 26) | |
|---|---|---|---|---|---|
| House dust mite | 92 (54%) | 64 (58%) | 42 (66%) | 34 (50%) | 16 (62%) |
| Dog | 40 (24%) | 29 (26%) | 21 (33%) | 15 (22%) | 6 (23%) |
| Cat | 61 (36%) | 44 (40%) | 27 (42%) | 21 (31%) | 8 (31%) |
| Grass pollen | 101 (59%) | 63 (57%) | 41 (64%) | 42 (62%) | 14 (54%) |
| Tree pollen | 76 (45%) | 49 (44%) | 36 (56%) | 28 (41%) | 7 (27%) |
| Cow’s milk | 9 (5%) | 4 (4%) | 7 (11%) | 5 (7%) | 4 (15%) |
| Hen’s egg | 8 (5%) | 5 (5%) | 7 (11%) | 7 (10%) | 1 (4%) |
| Peanut | 37 (22%) | 23 (31%) | 19 (30%) | 14 (21%) | 3 (12%) |
| Tree nuts | 45 (27%) | 31 (28%) | 25 (39%) | 21 (31%) | 5 (19%) |
| Soy | 30 (18%) | 15 (14%) | 14 (22%) | 7 (10%) | 2 (8%) |
| Wheat | 12 (7%) | 7 (6%) | 6 (9%) | 2 (3%) | 2 (8%) |
Differences in the degree of symptoms between children with and without sensitisation to whole allergens were small and rarely significant (Supplementary Table B). Because of this, we refrained from testing differences in symptom scores between children with and without sensitisation to individual allergen components.
Correlations between symptom scores and the number of whole allergens and the number of allergen components children were sensitised to were weak overall, with less than 10% of variance in symptom scores explained by variations in the number of allergens (components) the child was sensitised to (Table 3).
Table 3 Non-parametric correlation coefficients (Spearman’s ρ) between symptom scores and the number of whole allergens and the number of allergen components to which children were sensitised.
| ACQ | RQLQ | CDLQI | FAQLQ | QML | |
|---|---|---|---|---|---|
| Number of whole allergens child is sensitised to | 0.041 (p=0.503) | 0.160 (p=0.008) | 0.183 (p=0.002) | 0.007 (p=0.909) | 0.004 (p=0.945) |
| Number of allergen components child is sensitised to | 0.017 (p=0.777) | 0.247 (p<0.001) | 0.084 (p=0.167) | 0.044 (p=0.473) | –0.015 (p=0.811) |
ACQ, asthma control questionnaire; RQLQ, rhinitis quality of life questionnaire; CDLQI, children’s dermatology life quality index; FAQLQ, food allergy quality of life questionnaire; QML: quality of my life questionnaire.
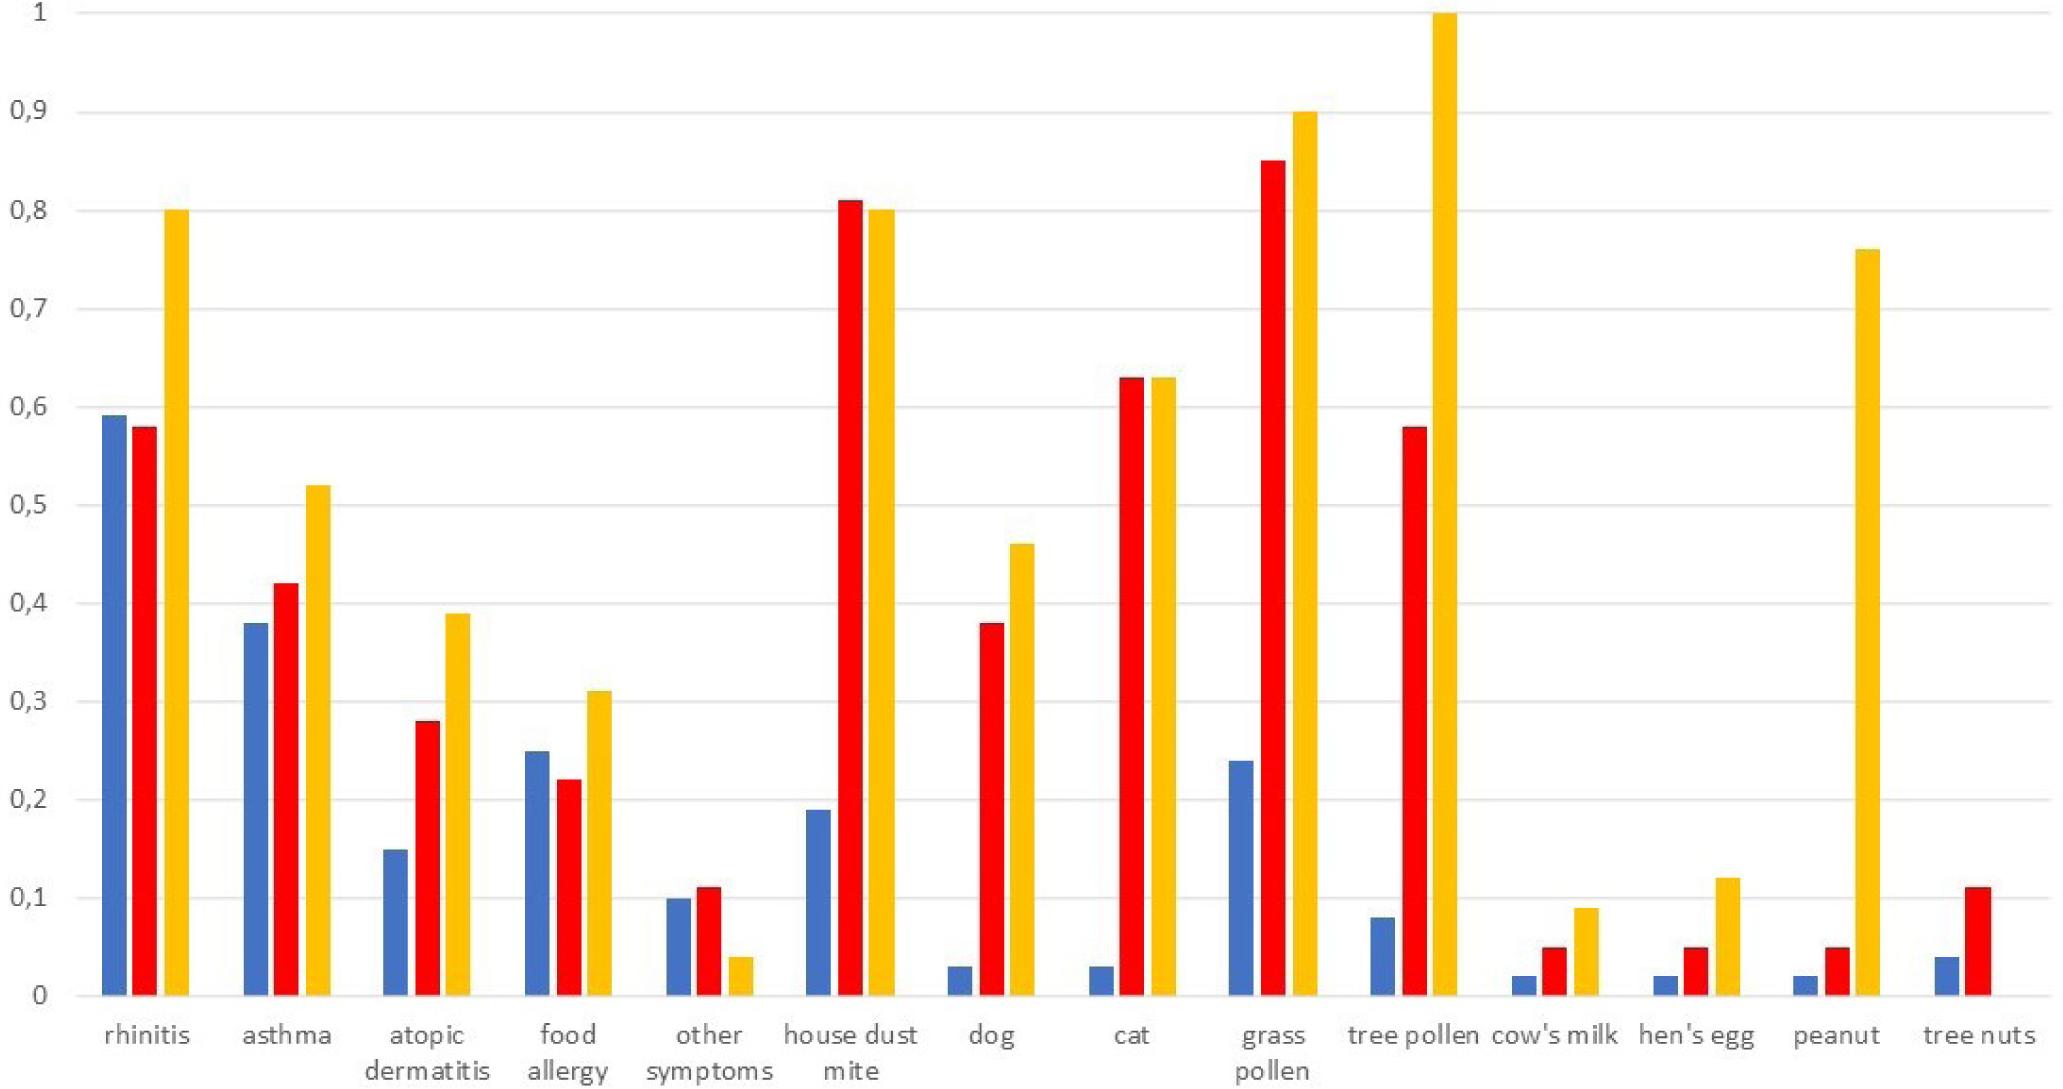
In LCA models, including symptom scores and whole allergen sensitisation, a three-class model exhibited the best statistical fit (AIC 3551, BIC 3709, likelihood ratio chi-squared 906, P<0.001). Figure 1 and Table 4 show the distribution of variables across classes in this model. Class 1 (n=135) showed relatively few symptoms (in particular little atopic dermatitis) and sensitisation to no or few allergens and was called “mild allergy”. Children in Class 2 (n=74) had more symptoms and showed sensitisation to a few, mostly inhalant, allergens (“respiratory allergy”), and those in Class 3 (n=60) showed most symptoms and sensitisation to a range of inhalant and food allergens (“polysensitisation”). Differences in allergen component sensitisation rates among the three classes are shown in Supplementary Table C, and Table 4 reflects the differences among the classes in whole allergen sensitisation rates. In the LCA analysis models in which symptom scores and allergen component sensitisation rates were entered, the likelihood maximisation algorithms failed to converge, and no classes of symptom and sensitisation patterns could be distinguished.
Figure 1 Distribution of symptoms and whole allergen sensitisation across the three classes distinguished by latent class analysis. Blue bars: class 1 (n = 135), red bars: class 2 (n = 74) and yellow bars: class 3 (n = 60).
Table 4 Distribution of variables across the three classes distinguished by latent class analysis.
| Class 1 (n = 135) | Class 2 (n = 74) | Class 3 (n = 60) | p | |
|---|---|---|---|---|
| Male gender | 70 (52%) | 44 (60%) | 36 (60%) | 0.431 |
| Age, mean (SD) | 7.6 (5.3) | 7.6 (4.7) | 9.4 (4.7) | 0.051 |
| Hay fever symptoms | 81 (60%) | 41 (55%) | 49 (82%) | 0.003 |
| RQLQ score, mean (SD) | 0.56 (0.76) | 0.44 (0.60) | 0.87 (0.84) | 0.003 |
| Asthma symptoms | 52 (39%) | 29 (39%) | 32 (53%) | 0.130 |
| ACQ, mean (SD) | 1.76 (4.07) | 1.48 (2.89) | 1.92 (3.43) | 0.772 |
| Eczema symptoms | 18 (13%) | 24 (32%) | 22 (37%) | <0.001 |
| CDLQI score, mean (SD) | 0.24 (0.95) | 0.74 (1.92) | 0.48 (1.14) | 0.032 |
| Food allergy symptoms | 34 (25%) | 17 (23%) | 18 (30%) | 0.641 |
| FAQLQ score, mean (SD) | 0.22 (0.60) | 0.20 (0.62) | 0.17 (0.40) | 0.851 |
| Other symptoms | 13 (10%) | 10 (14%) | 2 (3%) | 0.128 |
| QML score, mean (SD) | 86.5 (13.0) | 82.2 (20.0) | 85.6 (14.1) | 0.153 |
| Sensitised to house dust mite | 24 (18%) | 62 (84%) | 48 (80%) | <0.001 |
| Sensitised to grass pollen | 32 (24%) | 62 (84%) | 54 (90%) | <0.001 |
| Sensitised to tree pollen | 10 (7%) | 41 (55%) | 60 (100%) | <0.001 |
| Sensitised to dog | 3 (2%) | 29 (39%) | 27 (45%) | <0.001 |
| Sensitised to cat | 2 (2%) | 48 (65%) | 38 (63%) | <0.001 |
| Sensitised to cow’s milk | 3 (2%) | 4 (5%) | 5 (8%) | 0.146 |
| Sensitised to hen’s egg | 2 (2%) | 4 (5%) | 7 (12%) | 0.009 |
| Sensitised to peanut | 2 (2%) | 2 (3%) | 45 (75%) | <0.001 |
| Sensitised to tree nuts | 5 (4%) | 6 (8%) | 53 (88%) | <0.001 |
| Sensitised to soy | 1 (1%) | 2 (3%) | 31 (52%) | <0.001 |
| Sensitised to wheat | 3 (2%) | 2 (3%) | 9 (15%) | 0.001 |
| Sensitised to inhalant allergens | 59 (44%) | 74 (100%) | 60 (100%) | <0.001 |
| Sensitised to food allergens | 10 (7%) | 14 (19%) | 60 (100%) | <0.001 |
| Sensitised to inhalant and food allergens | 4 (3%) | 14 (19%) | 60 (100%) | <0.001 |
| Number of allergens child is sensitised to, median (range) | 0 (0–4) | 3 (2–6) | 6 (3–10) | <0.001 |
| Number of allergen components child is sensitised to, median (range) | 0 (0–13) | 2 (0–15) | 16.5 (0–58) | <0.001 |
RQLQ, rhinitis quality of life questionnaire; ACQ, asthma control questionnaire; CDLQI, children’s dermatology life quality index; FAQLQ, food allergy quality of life questionnaire; QML, quality of my life questionnaire.
Discussion
In this cohort of children referred for allergy testing by their GP or paediatrician, there was only a weak association of the type and severity of allergic symptoms to the patterns of sensitisation to whole allergens and allergen components. Inhalant and food allergen sensitisation was common, irrespective of the children’s allergic symptom type. In LCA, half of the children had mild allergy, with few symptoms and sensitisation to no or few allergens. The other half of the children were equally divided between a group with respiratory allergy and a group with polysensitisation and more severe symptoms of different organ systems. Adding CRD results to the LCA failed to result in identifiable classes of allergic disease in children.
The identification of one or more allergens that play a causative role in allergic symptoms in children varies from relatively straightforward to extremely complicated. Taking a detailed and structured history into account plays an important role in making or refuting a diagnosis of a specific allergy. For example, in a series of 280 peanut-sensitised children, peanut allergy could be reliably excluded in 55% of patients, and reliably diagnosed in 17%, based on history alone.4 Similarly, patients who report only symptoms of rhinitis or asthma during a specific pollen allergy season are likely to have a relevant allergy to that specific pollen.25,26 In the large majority of cases, however, a diagnosis of allergy cannot be made by considering history alone, but sensitisation tests are needed to raise or lower the probability of clinically relevant allergy to the possible allergen(s).1–3,25 Most clinicians and laboratories approach such testing in a stepwise panel approach, similar to what we did in this study: first a screening test for inhalant, food allergens or both, followed by a breakdown into the most common allergens after a positive screening test. Interpreting the results of such sensitisation tests within the context of a detailed structured history requires knowledge on the principles and characteristics of the test, and on the pre-test probability of a positive test result.1,25 The results of the present study confirm earlier observations that sensitisation to food and inhalant allergens frequently co-exist,22 irrespective of the nature of the child’s allergic symptoms (Table 2).1,2,25 Given the high likelihood of asymptomatic sensitisation in children, particularly for food allergens,1,2,5 a screening sensitisation test without a clear clinical suspicion is likely to generate more confusion than clarity. Therefore, the results of our study support the recommendation to screen only for suspected allergens dependent on the nature of the symptoms.25
The relationship between severity of allergic symptoms and sensitisation to individual allergens was weak (Supplementary Table B). This is in agreement with population-based studies, in which sensitisation to house dust mite shows only limited association to the presence or severity of asthma in children.13 Recent work has shown, however, that interaction patterns among different house dust mite allergen components show a considerably stronger relationship to asthma severity in children and adults,13,15 and the same goes for sensitisation to pet allergen components.10 Because of the high number of allergen components that can be tested, for example, in the ISAC ImmunoCAP assay, such relationships are difficult to tease out using simple bivariate statistics, such as correlation testing or t tests (Table 3 and Supplementary Table B). More advanced statistical tests, such as machine learning techniques,15 appear more promising in elucidating the complex relationship between allergen and allergen component sensitisation and the presence and severity of allergic disease in children.
Unsupervised classification techniques such as cluster analysis and LCA have been used to identify and characterise different phenotypes of asthma in children, both in population studies27,28 as well as in patient populations.29 Recently, LCA has also been used to distinguish different phenotypes of children with allergic rhinitis.30 We used LCA to identify patterns of different types of allergic symptoms (asthma, rhinitis, atopic dermatitis and food allergy) in relation to sensitisation to allergen and allergen components. The identification of a distinct phenotype of polysensitisation in this group of patients referred for allergy testing confirms earlier observations from population-based studies and clinical samples.22,31,32 Polysensitised children have a higher likelihood of having allergic symptoms from multiple organ systems (Table 4), particularly atopic dermatitis,31 and have more severe symptoms and reduced lung function.28 As expected, the results of our study show that these children are also sensitised to a high number of allergen components (Table 4). Recent studies have shown that sensitisation to multiple allergen components is associated with more severe allergic rhinitis symptoms,30 a higher likelihood of clinically relevant peanut allergy,33 more severe asthma13 and with the development of pet allergy.14 In our study, LCA was unable to identify distinct phenotypes of allergic symptoms in relation to sensitisation patterns of allergen components. Although there are no clear guidelines on the desired sample size for LCA,24 our study sample was relatively small compared to other studies using LCA,27,28,30 which may have limited our power to identify distinct phenotypes. Future studies in larger clinical samples of children with allergic disease, using standardised methods to record the presence and severity of symptoms (like we did) and applying advanced statistical tests including machine learning techniques are needed to further elucidate the relationship between symptoms of allergic disease in children and their sensitisation patterns to multiple allergen components. Such data may help clinicians to fine-tune their diagnostic approach for suspected allergies in children and may contribute in establishing the role of allergen component screening tests in paediatric allergy practice.
In conclusion, the relationship between the extent and degree of sensitisation to whole allergens or allergen components to allergic disease severity in children is weak. There appears to be three classes of symptom/sensitisation patterns in children with symptoms of allergic disease: mild allergy, respiratory allergy and polysensitisation. Broad screening for allergen component sensitisation did not contribute to distinguishing phenotypes of allergic disease.
Conflict of interest
The authors declare no conflicts of interest with respect to research, authorship and/or publication of this article.
Funding
This study was supported by an unrestricted research grant for investigator-initiated research by Thermo Fisher, Uppsala, Sweden, and by a grant of the Hein Hogerzeil Foundation for research between primary and secondary care, Zwolle, the Netherlands.
REFERENCES
1. Roberts G, Ollert M, Aalberse R, Austin M, Custovic A, DunnGalvin A, et al. A new framework for the interpretation of IgE sensitization tests. Allergy. 2016;71:1540–51. 10.1111/all.12939
2. Eigenmann PA, Atanaskovic-Markovic M, O'B HJ, Lack G, Lau S, Matricardi PM, et al. Testing children for allergies: why, how, who and when: An updated statement of the European Academy of Allergy and Clinical Immunology (EAACI) Section on Pediatrics and the EAACI-Clemens von Pirquet Foundation. Pediatr Allergy Immunol. 2013;24:195–209. 10.1111/pai.12066
3. Smith HE, Hogger C, Lallemant C, Crook D, Frew AJ. Is structured allergy history sufficient when assessing patients with asthma and rhinitis in general practice? J Allergy Clin Immunol. 2009;123:646–50. 10.1016/j.jaci.2008.11.005
4. van Veen WJ, Dikkeschei LD, Roberts G, Brand PL. Predictive value of specific IgE for clinical peanut allergy in children: relationship with eczema, asthma, and setting (primary or secondary care). Clin Transl Allergy. 2013;3:34. 10.1186/2045-7022-3-34
5. Burks AW, Tang M, Sicherer S, Muraro A, Eigenmann PA, Ebisawa M, et al. ICON: Food allergy. J Allergy Clin Immunol. 2012;129:906–20. 10.1016/j.jaci.2012.02.001
6. Fiocchi A, Nowak-Wegrzyn A. The fascinating world of molecular diagnosis in the management of food allergy: nondum matura est. Curr Opin Allergy Clin Immunol. 2011;11:200–3. 10.1097/ACI.0b013e32834694ae
7. Nicolaou N, Murray C, Belgrave D, Poorafshar M, Simpson A, Custovic A. Quantification of specific IgE to whole peanut extract and peanut components in prediction of peanut allergy. J Allergy Clin Immunol. 2011;127:684–5. 10.1016/j.jaci.2010.12.012
8. Nilsson C, Berthold M, Mascialino B, Orme ME, Sjolander S, Hamilton RG. Accuracy of component-resolved diagnostics in peanut allergy: systematic literature review and meta-analysis. Pediatr Allergy Immunol. 2020;31:303–14. 10.1111/pai.13201
9. Gray CL, Levin ME, du Toit G. Egg sensitization, allergy and component patterns in African children with atopic dermatitis. Pediatr Allergy Immunol. 2016;27:709–15. 10.1111/pai.12615
10. Schoos AM, Nwaru BI, Borres MP. Component-resolved diagnostics in pet allergy: Current perspectives and future directions. J Allergy Clin Immunol. 2021;147:1164–73. 10.1016/j.jaci.2020.12.640
11. Konradsen JR, Borres MP, Nilsson C. Unusual and unexpected allergic reactions can be unraveled by molecular allergy diagnostics. Int Arch Allergy Immunol. 2021;182:904–16. 10.1159/000515708
12. Barber D, Diaz-Perales A, Escribese MM, Kleine-Tebbe J, Matricardi PM, Ollert M, et al. Molecular allergology and its impact in specific allergy diagnosis and therapy. Allergy. 2021;76:3642–58. 10.1111/all.14969
13. Roberts G, Fontanella S, Selby A, Howard R, Filippi S, Hedlin G, et al. Connectivity patterns between multiple allergen specific IgE antibodies and their association with severe asthma. J Allergy Clin Immunol. 2020;146:821–30. 10.1016/j.jaci.2020.02.031
14. Asarnoj A, Hamsten C, Waden K, Lupinek C, Andersson N, Kull I, et al. Sensitization to cat and dog allergen molecules in childhood and prediction of symptoms of cat and dog allergy in adolescence: A BAMSE/MeDALL study. J Allergy Clin Immunol. 2016;137:813–21. 10.1016/j.jaci.2015.09.052
15. Fontanella S, Frainay C, Murray CS, Simpson A, Custovic A. Machine learning to identify pairwise interactions between specific IgE antibodies and their association with asthma: A cross-sectional analysis within a population-based birth cohort. PLoS Med. 2018;15:e1002691. 10.1371/journal.pmed.1002691
16. Koet LBM, Brand PLP. Increase in atopic sensitization rate among Dutch children with symptoms of allergic disease between 1994 and 2014. Pediatr Allergy Immunol. 2018;29:78–83. 10.1111/pai.12825
17. Lewis-Jones MS, Finlay AY. The Children's Dermatology Life Quality Index (CDLQI): initial validation and practical use. Br J Dermatol. 1995;132:942–9. 10.1111/j.1365-2133.1995.tb16953.x
18. Juniper EF, Howland WC, Roberts NB, Thompson AK, King DR. Measuring quality of life in children with rhinoconjunctivitis. J Allergy Clin Immunol. 1998;101:163–70. 10.1016/S0091-6749(98)70380-X
19. Juniper EF, Gruffydd-Jones K, Ward S, Svensson K. Asthma Control Questionnaire in children: validation, measurement properties, interpretation. Eur Respir J. 2010;36:1410–6. 10.1183/09031936.00117509
20. Flokstra-de Blok BM, Dunngalvin A, Vlieg-Boerstra BJ, Oude Elberink JN, Duiverman EJ, Hourihane JO, et al. Development and validation of a self-administered Food Allergy Quality of Life Questionnaire for children. Clin Exp Allergy. 2009;39:127–37. 10.1111/j.1365-2222.2008.03120.x
21. Gong GW, Young NL, Dempster H, Porepa M, Feldman BM. The Quality of My Life questionnaire: the minimal clinically important difference for pediatric rheumatology patients. J Rheumatol. 2007;34:581–7.
22. Baatenburg de Jong A, Dikkeschei LD, Brand PL. Sensitization patterns to food and inhalant allergens in childhood: A comparison of non-sensitized, monosensitized, and polysensitized children. Pediatr Allergy Immunol. 2011;22:166–71. 10.1111/j.1399-3038.2010.00993.x
23. van Hage M, Schmid-Grendelmeier P, Skevaki C, Plebani M, Canonica W, Kleine-Tebbe J, et al. Performance evaluation of ImmunoCAP(R) ISAC 112: a multi-site study. Clin Chem Lab Med. 2017;55:571–7. 10.1515/cclm-2016-0586
24. Weller BE, Bowen NK, Faubert SJ. Latent Class Analysis: A Guide to Best Practice. J Black Psychol. 2020;46:287–311. 10.1177/0095798420930932
25. Klok T, Ottink MD, Brand PLP. Question 6: What is the use of allergy testing in children with asthma? Paediatr Respir Rev. 2021;37:57–63. 10.1016/j.prrv.2020.07.007
26. Roberts G, Xatzipsalti M, Borrego LM, Custovic A, Halken S, Hellings PW, et al. Paediatric rhinitis: position paper of the European Academy of Allergy and Clinical Immunology. Allergy. 2013;68:1102–16. 10.1111/all.12235
27. Savenije OE, Granell R, Caudri D, Koppelman GH, Smit HA, Wijga A, et al. Comparison of childhood wheezing phenotypes in 2 birth cohorts: ALSPAC and PIAMA. J Allergy Clin Immunol. 2011;127:1505–12. 10.1016/j.jaci.2011.02.002
28. Belgrave DC, Granell R, Simpson A, Guiver J, Bishop C, Buchan I, et al. Developmental profiles of eczema, wheeze, and rhinitis: two population-based birth cohort studies. PLoS Med. 2014;11:e1001748. 10.1371/journal.pmed.1001748
29. Just J, Saint-Pierre P, Gouvis-Echraghi R, Laoudi Y, Roufai L, Momas I, et al. Childhood allergic asthma is not a single phenotype. J Pediatr. 2014;164:815–20. 10.1016/j.jpeds.2013.11.037
30. Yavuz ST, Oksel Karakus C, Custovic A, Kalayci O. Four subtypes of childhood allergic rhinitis identified by latent class analysis. Pediatr Allergy Immunol. 2021;32:1691–9. 10.1111/pai.13605
31. Broeks SA, Brand PL. Atopic dermatitis is associated with a fivefold increased risk of polysensitisation in children. Acta Paediatr. 2017;106:485–8. 10.1111/apa.13729
32. Herr M, Just J, Nikasinovic L, Foucault C, Le Marec AM, Giordanella JP, et al. Risk factors and characteristics of respiratory and allergic phenotypes in early childhood. J Allergy Clin Immunol. 2012;130:389–96. 10.1016/j.jaci.2012.05.054
33. Kaur N, Mehr S, Katelaris C, Wainstein B, Altavilla B, Saad R, et al. Added diagnostic value of peanut component testing: A cross-sectional study in Australian children. J Allergy Clin Immunol Pract. 2021;9:245–53. 10.1016/j.jaip.2020.08.060
Appendix
Number of children sensitised to each allergen component in the ISAC CRD and the median and range (ISU-E) rate of sensitisation to each component (n=287).
| Inhaled allergen | Component | Number (%) of children sensitised to this component | Median (range) sensitisation rate in those sensitised (ISU-E) |
|---|---|---|---|
| House dust mite | Blo t5 | 8 (2.8) | 1.49 (0.1–15.0) |
| Der f1 | 73 (25.4) | 15.7 (0.2–69.1) | |
| Der f2 | 71 (24.7) | 32.9 (0.5–107.1) | |
| Der p1 | 71 (24.7) | 26.4 (0.6–101.7) | |
| Der p10 | 6 (2.1) | 5.0 (0.1–7.0) | |
| Der p2 | 74 (25.8) | 34.2 (0.4–112.7) | |
| Der p23 | 58 (20.2) | 8.5 (0.1–103) | |
| Storage mite | Lep d2 | 10 (3.5) | 1.7 (1.0–6.0) |
| Dog | Can f1 | 18 (6.3) | 1.7 (0.1–64) |
| Can f2 | 9 (3.1) | 10.0 (1.0–54.0) | |
| Can f3 | 3 (1.0) | 2.2 (2.0–15.0) | |
| Can f 4 | 7 (2.4) | 7.4 (1.0–65.0) | |
| Can f5 | 11 (3.8) | 0.8 (0.1–23.0) | |
| Can f6 | 11 (3.8) | 1.9 (0.1–66.0) | |
| Cat | Fel d1 | 53 (18.5) | 4.4 (0.1–71.0) |
| Fel d2 | 3 (1.0) | 1.2 (1.0–5.0) | |
| Fel d4 | 10 (3.5) | 0.7 (0.1–27.0) | |
| Alder pollen | Alng1 | 48 (16.7) | 4.0 (0.4–48.9) |
| Birch pollen | Bet v1 | 67 (23.3) | 9.6 (0.2–115.8) |
| Bet v2 | 12 (4.2) | 3.6 (0.1–86.0) | |
| Bet v4 | 0 | — | |
| Hazel pollen | Cor a 1.0101 | 44 (15.3) | 2.4 (0.2–27.9) |
| Japanese cedar | Cry j1 | 6 (2.1) | 0.6 (0.1–3.0) |
| Cypress pollen | Cup a1 | 6 (2.1) | 0.7 (0.1–2.0) |
| Plane pollen | Pla a1 | 0 | — |
| Pla a3 | 2 (0.7) | 3.6 (0.1–7) | |
| Olive pollen | Ole e1 | 29 (10.7) | 2.3 (0.2–115.0) |
| Ole e7 | 1 (0.3) | 1.0 | |
| Ole e9 | 4 (1.4) | 0.7 (0.1–1.0) | |
| Bermuda grass pollen | Cyn d1 | 54 (18.8) | 6.4 (0.3–109.5) |
| Timothy grass pollen | Phl p1 | 75 (26.1) | 18.1 (0.2–117.4) |
| Phl p2 | 34 (11.8) | 8.0 (0.3–75.1) | |
| Phl p4 | 43 (15.0) | 5.2 (0.3–92.4) | |
| Phl p5 | 39 (13.6) | 34.0 (0.1–105.0) | |
| Phl p6 | 32 (11.1) | 5.2 (0.1–40.0) | |
| Phl p7 | 0 | — | |
| Phl p11 | 23 (8.0) | 8.8 (0.1–52.0) | |
| Phl p12 | 7 (2.4) | 6.2 (1.0–23.0) | |
| Plantain pollen | Pla l1 | 2 (0.7) | 2.7 (1.0–4.0) |
| Ragweed pollen | Amb a1 | 0 | — |
| Mugwort pollen | Art v1 | 2 (0.7) | 3.2 (2.0–5.0) |
| Art v3 | 1 (0.3) | 4.0 | |
| Goosefoot pollen | Che a1 | 8 (2.8) | 1.0 (0.1–7.0) |
| Annual mercury pollen | Mer a1 | 12 (4.2) | 4.8 (1.0–100.0) |
| Wall pellitory pollen | Par j2 | 4 (1.4) | 0.5 (0.1–1.0) |
| Saltwort pollen | Sal k1 | 0 | — |
| Cockroach | Bla g1 | 2 (0.7) | 0.3 (0.2–0.4) |
| Bla g2 | 0 | — | |
| Bla g5 | 0 | — | |
| Bla g7 | 2 (0.7) | 4.5 (1.0–6.5) | |
| Horse | Equ c1 | 20 (7.0) | 1.1 (0.1–53.0) |
| Equ c3 | 1 (0.3) | 6.4 | |
| Mouse | Mus m1 | 6 (2.1) | 13.4 (0.1–76.0) |
| Fungi | Component | Number (%) of children sensitised to this component | Median (range) sensitisation rate in those sensitised (ISU-E) |
|---|---|---|---|
| Alternaria | Alt a1 | 12 (4.2%) | 1.0 (0.1–82.0) |
| Alt a6 | 2 (0.7%) | 8.2 (3.8–12.7) | |
| Aspergillus | Asp f1 | 0 | — |
| Asp f3 | 3 (1.0) | 4.0 (1.0–7.0) | |
| Asp f6 | 0 | — | |
| Cladosporium | Cla h8 | 3 (1.0) | 0.4 (0.1–1.0) |
| Food allergen | Component | Number (%) of children sensitised to this component | Median (range) sensitisation rate in those sensitised (ISU-E) |
|---|---|---|---|
| Cow’s milk | Bos d4 | 2 (0.7) | 1.3 (0.6–2.0) |
| Bos d5 | 2 (0.7) | 0.8 (0.8–0.8) | |
| Bos d6 | 2 (0.7) | 1.3 (1.0–2.0) | |
| Bos d8 | 3 (1.0) | 0.6 (0.1–2.0) | |
| Bos d lactoferrin | 2 (0.7) | 1.0 (0.1–2.0) | |
| Hen’s egg | Gal d1 | 7 (2.4) | 1.9 (0.1–36.0) |
| Gal d2 | 8 (2.8) | 0.8 (1.0–4.0) | |
| Gal d3 | 0 | — | |
| Gal d5 | 0 | — | |
| Soy | Gly m4 | 29 (10.1) | 2.8 (0.1–24) |
| Gly m5 | 3 (1.0) | 0.8 (0.7–3.4) | |
| Gly m6 | 5 (1.7) | 0.6 (0.1–9) | |
| Peanut | Ara h1 | 6 (2.1) | 0.6 (1.0–2.0) |
| Ara h2 | 8 (2.8) | 9.6 (0.1–92.0) | |
| Ara h3 | 2 (0.7) | 3.0 (2.0–4.0) | |
| Ara h6 | 5 (1.7) | 10.0 (3.0–41.0) | |
| Ara h8 | 37 (12.9) | 2.4 (0.1–33.0) | |
| Ara h9 | 2 (0.7) | 1.3 (0.1–2.0) | |
| Hazelnut | Cor a14 | 9 (3.1) | 6.9 (0.1–15.0) |
| Cor a 1.0401 | 53 (18.5) | 3.8 (0.4–58.7) | |
| Cor a8 | 1 (0.3) | 17.0 | |
| Cor a9 | 4 (1.4) | 0.9 (0.1–4.0) | |
| Cashew | Ana02 | 4 (1.4) | 0.4 (0.1–1.0) |
| Ana 03 | 13 (14.5) | 1.4 (0.1–83.0) | |
| Brazil nut | Ber e1 | 2 (0.7) | 0.7 (0.6–0.8) |
| Walnut | Jug r1 | 11 (3.8) | 3.8 (0.1–9.0) |
| Jug r3 | 2 (0.7) | 3.3 (0.4–6.2) | |
| Sesame seed | Ses i1 | 1 (0.3) | 0.4 |
| Wheat | Tri a14 | 1 (0.3) | 1.3 |
| Tri a19.0101 | 2 (0.7) | 0.4 (0.2–0.6) | |
| Tri aA_TI | 1 (0.3) | 0.8 | |
| Buckwheat | Fag e2 | 1 (0.3) | 0.7 |
| Kiwi | Actd1 | 10 (3.5) | 1.0 (0.1–19.0) |
| Actd2 | 5 (1.7) | 1.5 (0.1–5.0) | |
| Actd5 | 0 | — | |
| Actd8 | 28 (9.8) | 1.6 (0.1–33.0) | |
| Celery | Api g1 | 24 (8.4) | 1.6 (0.7–23.0) |
| Red meat | Alpha-Gal | 1 (0.3) | 0.3 |
| Cod | Gad c1 | 3 (1.0) | 9.1 (0.6–39.1) |
| Shrimp | Pen m1 | 5 (1.7) | 2.4 (0.5–5.0) |
| Pen m2 | 4 (1.4) | 0.7 (0.3–35.3) | |
| Pen m4 | 2 (0.7) | 0.5 (0.4–0.6) | |
| Apple | Mal d1 | 55 (19.2) | 4.0 (0.3–79.7) |
| Peach | Pru p1 | 52 (18.1) | 1.8 (0.1–9.3) |
| Pru p3 | 2 (0.7) | 3.2 (0.1–6.0) |
| Other allergens | Component | Number (%) of children sensitised to this component | Median (range) sensitisation rate in those sensitised (ISU-E) |
|---|---|---|---|
| Anisakis | Ani s1 | 0 | — |
| Ani s3 | 5 (1.7) | 2.7 (0.1–6.0) | |
| Latex | Hev b1 | 0 | — |
| Hev b3 | 0 | — | |
| Hev b5 | 0 | — | |
| Hev b6 | 0 | — | |
| Hev b8 | 12 (4.2) | 5.8 (0.1–94.0) |
95% confidence intervals of the difference in symptom scores between children with and without sensitisation to whole allergens.
| RQLQ | ACQ | CDLQI | FAQLQ | QML | |
|---|---|---|---|---|---|
| House dust mite | −0.27 to 0.09 | −1.24 to 0.53 | −0.61 to 0.03 | −0.11 to 0.16 | −0.40 to 7.00 |
| Dog | −0.34 to 0.08 | −1.44 to 0.62 | −0.94 to 0.18 | −0.12 to 0.20 | −1.37 to 7.55 |
| Cat | −0.20 to 0.17 | −1.23 to 0.66 | −0.70 to −0.03 (P=0.033) |
−0.12 to 0.17 | −2.18 to 5.69 |
| Grass pollen | −0.40 to −0.05 (P=0.011) |
−0.44 to 1.34 | −0.58 to 0.02 | −0.15 to 0.12 | −3.87 to 3.57 |
| Tree pollen | −0.33 to 0.04 | −0.50 to 1.30 | −0.35 to 0.26 | 0.02 to 0.26 (P=0.023) |
−4.78 to 2.78 |
| Cow’s milk | −0.61 to 0.38 | −0.98 to 3.34 | −1.80 to 0.08 | −0.83 to 0.25 | −8.90 to 12.82 |
| Hen’s egg | −0.33 to 0.52 | −0.19 to 2.02 | −3.59 to 0.60 | −0.74 to 0.17 | −9.57 to 2.24 |
| Peanut | −0.57 to −0.07 (P=0.012) |
−0.93 to 1.24 | −0.47 to 0.31 | −0.10 to 0.18 | −5.04 to 3.35 |
| Tree nuts | −0.46 to 0.00 (P=0.05) |
−0.98 to 0.97 | −0.50 to 0.21 | −0.16 to 0.13 | −3.27 to 5.28 |
| Soy | −0.76 to −0.16 (P=0.03) |
−1.30 to 1.43 | −0.67 to 0.34 | −0.06 to 0.24 | −6.57 to 4.51 |
| Wheat | −0.93 to −0.01 (P=0.049) |
0.89 to 2.13 (p<0.001) |
−1.27 to 0.32 | −0.37 to 0.42 | −7.82 to 10.19 |
ACQ, asthma control questionnaire; RQLQ, rhinitis quality of life questionnaire; CDLQI, children’s dermatology life quality index; FAQLQ, food allergy quality of life questionnaire; QML, quality of my life questionnaire.
Allergen component sensitisation rates compared among the three classes as distinguished by latent class analysis (results only shown for allergen components with significantly different sensitisation rates among classes; all other components, P > −0.05).
| Class 1 (n = 135) | Class 2 (n = 74) | Class 3 (n = 60) | P | |
|---|---|---|---|---|
| Act d8 (kiwi) | 12 (9%) | 2 (3%) | 12 (20%) | 0.003 |
| Aln g1 (alder pollen) | 17 (13%) | 6 (8%) | 21 (35%) | <0.001 |
| Can f1 (dog) | 5 (4%) | 3 (4%) | 8 (13%) | 0.023 |
| Can f2 (dog) | 1 (1%) | 0 (0%) | 7 (12%) | <0.001 |
| Can f4 (dog) | 1 (1%) | 0 (0%) | 4 (7%) | 0.007 |
| Can f6 (dog) | 4 (3%) | 1 (1%) | 6 (10%) | 0.027 |
| Ara h8 (peanut) | 13 (10%) | 5 (7%) | 17 (28%) | <0.001 |
| Bet v1 (birch pollen) | 24 (18%) | 15 (20%) | 23 (38%) | 0.006 |
| Bos d Lactoferrin (cow’s milk) | 0 (0%) | 0 (0%) | 2 (3%) | 0.030 |
| Cor a1.0101 (hazel pollen) | 15 (11%) | 6 (8%) | 20 (33%) | <0.001 |
| Cor a1.0401 (hezelnut) | 19 (14%) | 8 (11%) | 21 (35%) | <0.001 |
| Cry j1 (Japanese cedar) | 1 (1%) | 0 (0%) | 5 (8%) | 0.001 |
| Cynd1 (bermuda grass pollen) | 20 (15%) | 12 (16%) | 18 (30%) | 0.035 |
| Blo t5 (house dust mite) | 1 (1%) | 1 (1%) | 4 (7%) | 0.029 |
| Der f1 (house dust mite) | 21 (16%) | 15 (20%) | 29 (48%) | <0.001 |
| Der f2 (house dust mite) | 24 (18%) | 17 (23%) | 23 (38%) | 0.008 |
| Der p1 (house dust mite) | 22 (16%) | 13 (18%) | 28 (47%) | <0.001 |
| Der p2 (house dust mite) | 26 (19%) | 17 (23%) | 24 (40%) | 0.008 |
| Der p23 (house dust mite) | 20 (15%) | 11 (15%) | 21 (35%) | 0.002 |
| Fel d1 (cat) | 12 (9%) | 15 (20%) | 20 (33%) | <0.001 |
| Gad c1 (cod) | 0 (0%) | 0 (0%) | 3 (5%) | 0.005 |
| Gly m4 (soy) | 11 (8%) | 2 (3%) | 14 (23%) | <0.001 |
| Mal d1 (apple) | 19 (14%) | 9 (12%) | 21 (35%) | 0.001 |
| Ole e1 (olive pollen) | 9 (7%) | 8 (11%) | 11 (18%) | 0.048 |
| Par j2 (wall pellitory pollen) | 1 (1%) | 0 (0%) | 3 (5%) | 0.035 |
| Phl p1 (timothy grass pollen) | 27 (20%) | 20 (27%) | 23 (38%) | 0.026 |
| Phl p2 (timothy grass pollen) | 14 (10%) | 4 (5%) | 13 (22%) | 0.011 |
| Phl p4 (timothy grass pollen) | 18 (13%) | 6 (8%) | 15 (25%) | 0.019 |
| Phl p5 (timothy grass pollen) | 13 (10%) | 8 (11%) | 17 (28%) | 0.002 |
| Phl p6 (timothy grass pollen) | 11 (8%) | 7 (10%) | 13 (22%) | 0.020 |
| Pru p1 (peach) | 20 (15%) | 6 (8%) | 21 (35%) | <0.001 |
| Tri a19.0101 (wheat) | 0 (0%) | 0 (0%) | 2 (3%) | 0.030 |