
Download
ORIGINAL ARTICLE
Impact of allergic reactions and urticaria on mental health and quality of life
Pia-Charlotte Stadlera, Enklajd Marselaa, Till Kämmerera, Leonie H. Frommherza, Benjamin Clanner-Engelshofena, Lars E. Frencha, b, Eva Oppela*, Markus Reinholza
aDepartment of Dermatology and Allergy, University Hospital, LMU Munich, Munich, Germany
bDr. Phillip Frost Department of Dermatology & Cutaneous Surgery, Miller School of Medicine, University of Miami, Miami, FL, USA
Abstract
Background Allergic diseases represent a major global health issue with more than one-third of the global population affected by at least one allergic condition. Allergic conditions can not only cause life-threatening anaphylactic reactions but also impact daily life with a significant influence on mental health and the quality of life (QoL).
Objectives This study aims to evaluate the health-related QoL and depression severity among patients presenting in a tertiary care allergy center.
Methods A cross-sectional study was conducted among 596 patients presenting with allergic symptoms or previously diagnosed allergies between October 2018 and April 2019.
Patients were screened for depression and the QoL impairment by using three validated scales: the Beck Depression Inventory (BDI), the Dermatologic Life Quality Index (DLQI), and the three-level version of the EuroQol 5-Dimensional (EQ-5D-3L) scale.
Results One-third (34.8%) of the study population was male and two-thirds (65.2%) were female. About 73.7% (n = 427/579) of the patients suffered from at least one previously diagnosed allergic disease, most frequently to pollen (37.0%, n = 214/579) and food (27.3%, n = 158/579), and 20.0 % (n = 116/579) suffered from urticaria. About 19.3% of the total population suffered from depression. Urticaria, as well as insect venom, food/food additives, and drug allergies significantly affected the QoL and depression severity (p < 0.001), reflected by higher DLQI and BDI scores, and lower scores in the EQ5D-3L index.
Conclusion Our results provide evidence for a possible correlation of allergies (e.g. against insect venom, food/food additives, and drugs) and/or urticaria with a reduced QoL and a higher depression rate. Patients particularly indicated restrictions for the dimensions, pain/discomfort as well as anxiety/depression. It might be beneficial to implement a standardized questionnaire as a regular screening method for evaluating the mental health status of patients with allergies and/or urticaria.
Key words: immediate-type hypersensitivity reactions, urticaria, mental health, quality of life, depression, allergies
*Corresponding author: PD Dr. med. Markus Reinholz, MD PhD, Department of Dermatology and Allergy, University Hospital, LMU Munich, Frauenlobstr. 9–11, 80337 Munich, Germany. Email address: [email protected]
Received 9 October 2021; Accepted 11 November 2021; Available online 1 March 2022
Copyright: Stadler P-C, et al.
License: This open access article is licensed under Creative Commons Attribution 4.0 International (CC BY 4.0). http://creativecommons.org/licenses/by/4.0/
Introduction
The prevalence of allergies and allergic diseases (e.g., allergic rhinitis) has noticeably increased over the last century, with about 30–40% of the world population affected by at least one allergic condition.1 Allergies are caused by an aberrant immunological response to an otherwise harmless environmental stimulus and are commonly divided into four different types (I–IV).2 Type I hypersensitivity reactions are immediate reactions mediated by preformed Immunoglobulin E (IgE) antibodies on the surface of mast cells crosslinking with the antigen and subsequently leading to the release of inflammatory cytokines within minutes.3 Clinical findings may vary from mild pruritus and rash to severe anaphylaxis, including dyspnea, bronchospasm, and hypotension.4 In Western countries—e.g., in the United States—10.7% of children reported allergies against aeroallergens5 and 8% against food, mostly against chicken egg white, cow´s milk, soy, wheat, fish, walnut, and legumes.6 Furthermore, 10–30% of the global population suffers from allergic rhinitis,1 and in 50% of the cases, pollen allergies are accompanied by cross allergies against food or food additives.7 Moreover, one of the most common reasons in adults for severe anaphylactic reactions including hypotension and bronchospasm are hymenopteran venom allergies.8 A study from 2005 showed that one-third of the patients with hymenopteran venom allergies developed severe life-threatening symptoms, resulting in a decreased QoL of those patients.9,10 Similar to type I allergies, urticaria is also mediated by mast cell activation and belongs to the most common dermatological skin diseases worldwide. It can last for years and then cause considerable distress due to its severe pruritus.11 The etiology of urticaria has not been fully elucidated yet, but different triggers such as type I allergies, pseudoallergies, autoimmunity, drugs, and infections have been identified as causal factors.12 Urticaria is characterized by highly pruritic wheals with rapid fluctuation within 24 h which may be accompanied by angioedema, with a 2:1 ratio of prevalence in women than men.11,13 Therapeutically, the use of antihistamines, mast cell stabilizers, or anti-IgE-receptor antibodies can be considered. Furthermore, for type I allergies, e.g., hay fever and hymenopteran venom allergies, patients can receive a specific immunotherapy.14 However, type I allergies and urticaria affect a large number of people worldwide and can cause severe distress leading to a reduced QoL.9,15–17 In this study, we assessed the health-related quality of life (HRQoL) and the epidemiological characteristics of depression in patients suffering from immediate-type hypersensitivity reactions and/or urticaria.
Methods
Study participants
Following ethical approval granted by the Ethics Committee of Ludwig-Maximilian-University (LMU), Munich, Germany, the anonymous survey was prospectively conducted among 596 patients presenting between October 2018 and April 2019 in the allergy outpatient clinic of the Dermatology and Allergy Department, University Hospital, LMU Munich. Adult patients, aged ≥18 years, were asked by either a physician or a nurse to complete a self-administered five-page questionnaire. Participation was voluntary, not incentivized, and all participants consented verbally before completing the questionnaire. Refusals were not additionally documented. In compliance with the cross-sectional study design, each patient could participate only once in the study.
Survey
The questionnaire included items on individual characteristics, past medical history of specific allergy entities, HRQoL utilizing validated questionnaires (DLQI, EQ-5D-3L), and severity of depression using the Beck Depression Inventory (BDI). In the questionnaire, questions were not distinguished between those pertinent to allergy and those pertinent to intolerance reactions. The 3-level version of the EuroQol 5-dimensional (EQ-5D-3L) questionnaire measured the generic health status with regard to five dimensions: mobility, self-care, usual activities, pain/discomfort, and anxiety/depression in three levels.18 We calculated an index for EQ5D-3L with a maximum of 1, representing the best generic health status for the patient. The Dermatology Life Quality Index (DLQI) measures the HRQoL of people suffering from a skin disease within the previous 7 days.19 A score of zero indicated no impact, while a score of 30 represented a very severe impairment of the QoL. The BDI was a 21-question multiple-choice psychometric test for measuring the severity of depression. A BDI score value from 12 to 18 was interpreted as mild depression, from 19 to 29 as moderate depression, and ≥ 30 as severe depression.20
Statistical analysis
All analyses were performed by using the statistical software package SPSS Statistics 26.0 (IBM Corp., 2019, Armonk, NY/USA). Categorical items were expressed as frequencies and percentages. Descriptive analyses included means with standard deviations (SD), medians, and interquartile ranges. Differences between two groups were assessed by performing chi-quadrat tests for association between two nominal variables or Mann–Whitney-U tests for group differences concerning ordinal or nonnormal data. For multivariable approaches, we used a logistic regression. Each analysis included the number of considered participants to account for missing data. In all cases, a p-value ≤ 0.05 was deemed statistically significant.
Results
Demographics
A total of 595 patients who were referred to the Allergy Center of the Department of Dermatology and Allergy, LMU Munich, between October 2018 and April 2019, participated in this study. One-third (34.8%) was male and two-thirds (65.2%) were female with a mean age of 44 years (range: 18–91 years). Nearly half of the patients were single (42.2%) or married (46.0%), and a minority were divorced (9.3%) or widowed (2.5%). Most patients visited a secondary school (37.4%) or had a university degree (35.6%). Furthermore, 90.2% had statutory health insurance, and only 9.8% of the patients had a private health insurance (Table 1).
Table 1 Demographics and patient characteristics.
| n = 596 | Percentage | |
|---|---|---|
| Gender | ||
| Male | 207 | 34.8 |
| Female | 387 | 65.2 |
| Marital status | ||
| Single | 250 | 42.2 |
| Married | 273 | 45.9 |
| Divorced | 55 | 9.2 |
| Widowed | 15 | 2.5 |
| School type | ||
| No or other school degree | 15 | 2.6 |
| Secondary school | 226 | 37.4 |
| Grammar school | 138 | 23.5 |
| University degree | 209 | 35.6 |
| Health insurance | ||
| State | 532 | 90.2 |
| Private | 58 | 9.8 |
| Mean age | 44.4 (± 16.1 SD) |
Allergies
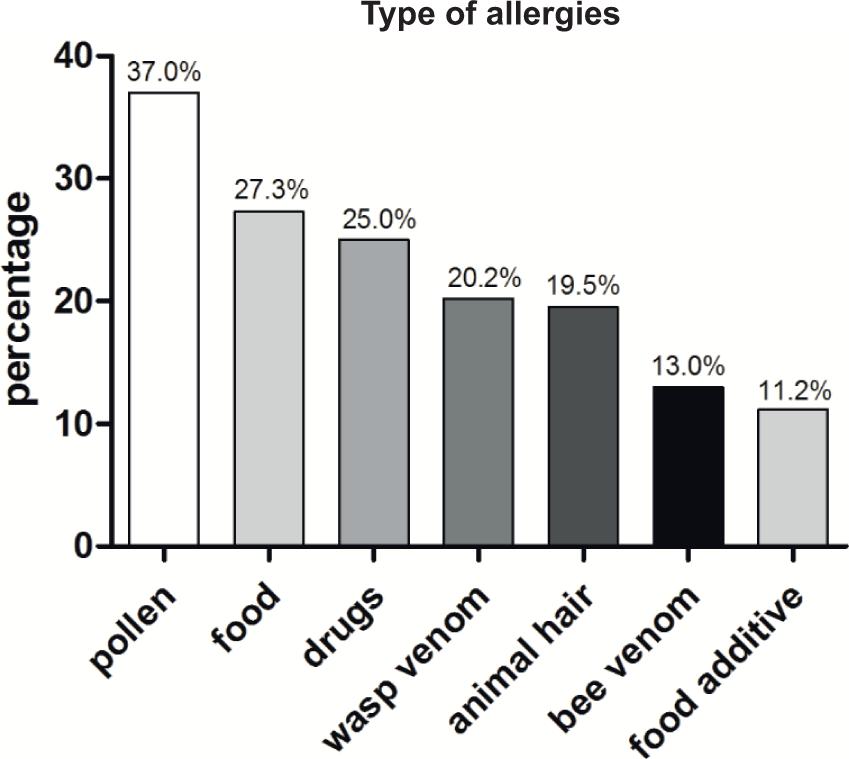
The majority (73.8%, n = 427/579) of the patients suffered, according to their statements, from at least one previously diagnosed allergic disease (Table 2). The most frequently reported allergens were pollen (37.0%, n = 214/579) and food (27.3%, n = 158/579) (Figure 1). Women had significantly more often three or more allergies compared to men (p = 0.006; 32.3% vs. 19.4%) (Table 2). Allergies against food or drugs were significantly more frequent in women (p = 0.001; p = 0.000). About 12.5% (n = 26/207) of men had drug allergies and 7.2% (n = 15/207) had food allergies, whereas the prevalence of drug allergies in women was 30.9% (n = 120/387) and the prevalence of food allergies in women was 13.2% (n = 50/387) (Table 3). Patients suffering from urticaria (n = 116) showed significantly less frequent allergies against bee (p = 0.027; 6.9% vs. 14.7%) or wasp venom (p = 0.007; 11.2% vs. 22.4%) than patients without urticaria (Suppl. Table 1). While allergies against pollen or animal hair had no significant impact on the QoL or depression, urticaria, as well as insect venom, food/food additives, and drug allergies significantly affected the QoL and depression severity (p < 0.001) (Table 4). Patients affected by these allergies showed higher scores in the DLQI and BDI and lower scores in the EQ5D-3L index (Table 4). Relationship status and school education did not seem to influence the prevalence of allergies and there was no significant correlation between the presence of allergies and the health insurance status (p = 0.421) (Suppl. Table 2). The relationship status and status of school education was no statistical analysed as some variables were mentioned to less.
Figure 1 Allergy entities of the patient collective. Pollen (36.2%), food (26.7%), drugs (24.2%), wasp venom (20.1%), animal hair (19.4%), bee venom (12.9%), and food additive (10.9%), Total (n) = 579.
Table 2 Number of allergies and gender.
| Number of allergies | No allergy | One allergy | Two allergies | Three or more allergies |
|---|---|---|---|---|
| Male | ||||
| n | 56 | 59 | 47 | 39 |
| Percentage | 27.9% | 29.4% | 23.4% | 19.4% |
| Female | ||||
| n | 96 | 100 | 60 | 122 |
| Percentage | 25.4% | 26.5% | 15.9% | 32.3% |
| Total population | ||||
| n | 152 | 159 | 107 | 161 |
| Percentage | 26.3% | 27.5% | 18.5% | 27.8% |
Table 3 Type of allergies and gender.
| Food | Food additive | Drugs | |
|---|---|---|---|
| Male | |||
| n | 38 | 15 | 26 |
| Percentage | 18.9% | 7.5% | 12.5% |
| Female | |||
| n | 120 | 50 | 120 |
| Percentage | 31.7% | 13.2% | 30.9% |
| p-values* | 0.001 | 0.036 | <0.001 |
*Pearson-Chi Quadrat test.
p-value ≤ 0.05
Table 4 Correlation between allergies/urticaria and the QoL and depression.
| (n = 579) | EQ5D | DLQI p-values* (r) | BDI | |||
|---|---|---|---|---|---|---|
| Allergies | Pollen | 214 | 37.0% | 0.157 (−0.06) | 0.723 (−0.02) | 0.333 (−0.04) |
| Animal hair | 113 | 19.5% | 0.204 (−0.05) | 0.797 (−0.01) | 0.246 (−0.05) | |
| Wasp venom | 117 | 20.2% | <0.001 (−0.18) | <0.001 (−0.22) | <0.001 (−0.19) | |
| Bee venom | 75 | 13.0% | <0.001 (−0.16) | <0.001 (−0.21) | <0.001 (−0.20) | |
| Food | 158 | 27.3% | <0.001 (−0.19) | 0.119 (−0.06) | <0.001 (−0.20) | |
| Food additives | 65 | 11.2% | <0.001 (−0.21) | 0.004 (−0.12) | <0.001 (−0.16) | |
| Drugs | 145 | 25.0% | <0.001 (−0.17) | <0.001 (−0.15) | <0.001 (−0.18) | |
| Urticaria | Urticaria | 116 | 20.0% | <0.001 (−0.20) | <0.001 (−0.38) | <0.001 (−0.29) |
*Mann–Whitney U-test.
Quality of Life and depression
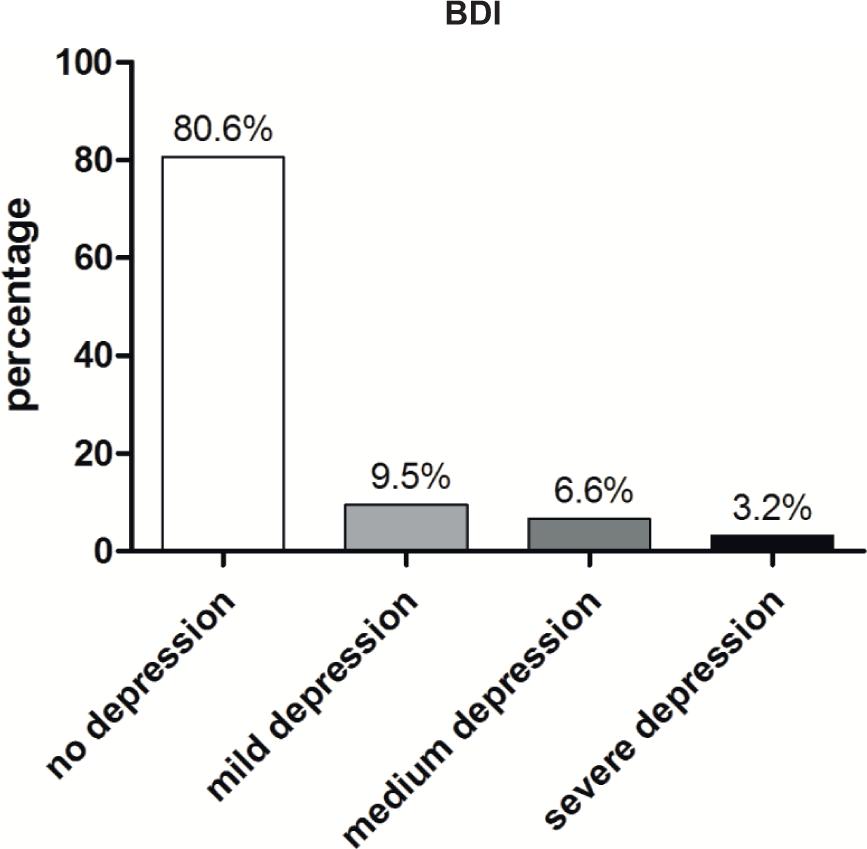
The total population had a medium DLQI score of 4.70 (n = 695), a medium BDI score of 6.94 (n = 527), and a medium EQ5D-3L index score of 0.89 (n = 595). Analyzing the five dimensions of EQ5D-3L, the majority of patients showed level one for all five dimensions. About 0.3% of the patients showed level three in mobility, 0.2% in self-care, 1.2% in usual activities, 5.9% in pain/discomfort, and 3.6% in anxiety/depression (Suppl. Table 3). The EQ5D-3L index score correlated significantly with the age of the patients; older patients had a statistically lower score (p.024). About 19.3% (n = 102/527) of the total population suffered from depression, while around 3.2% (n = 17/527) had severe depression (Figure 2). In general, women scored significantly worse in the QoL and depression compared to men (Table 5). In addition, older patients had statistically a higher BDI score compared to younger ones and therefore a higher depression rate (p = 0.041, OR = 1.013). Furthermore, patients with allergies or urticaria significantly showed a tendency to significantly lower life quality and higher depression rates, compared to healthy ones (Table 4). Relationship status and school education did not seem to have an impact on the QoL or depression rate, but some variables were mentioned to be less that statistical quantification could not be performed. Furthermore, patients with private health insurance statistically showed a better QoL rate with lower values for DLQI and higher values for the EQ5D-3L index (Suppl. Table 4).
Figure 2 Depression rate of the patient collective. None (80.6%), mild depression (9.5%), medium depression (6.6%), and severe depression (3.2%), Total (n) = 527.
Table 5 Correlation between patient characteristics and the QoL and depression.
| n | Mean | Standard deviation | p-values* (r) | |
|---|---|---|---|---|
| Gender: | ||||
| Male | ||||
| EQ5D | 207 | 0.93 | ± 0.13 | 0.001 (−0.17) |
| DLQI | 207 | 3.80 | ± 5.37 | 0.019 (−0.10) |
| BDI | 188 | 5.25 | ± 7.58 | <0.001 (−0.13) |
| Female | ||||
| EQ5D | 387 | 0.88 | ± 0.20 | 0.001 (−0.17) |
| DLQI | 387 | 5.19 | ± 6.58 | 0.019 (−0.10) |
| BDI | 338 | 7.90 | ± 9.16 | <0.001 (−0.13) |
| Allergies | ||||
| With allergies | ||||
| EQ5D | 517 | 0.89 | ± 0.18 | 0.057 (−0.08) |
| DLQI | 517 | 4.84 | ± 6.14 | 0.004 (−0.12) |
| BDI | 456 | 7.00 | ± 8.83 | 0.180 (−0.06) |
| Without allergies | ||||
| EQ5D | 54 | 0.95 | ± 0.89 | 0.057 (−0.08) |
| DLQI | 54 | 3.02 | ± 5.59 | 0.004 (−0.12) |
| BDI | 52 | 4.75 | ± 5.56 | 0.180 (−0.06) |
| Urticaria | ||||
| With urticaria | ||||
| EQ5D | 116 | 0.83 | ± 0.22 | <0.001 (−0.20) |
| DLQI | 116 | 8.91 | ± 6.77 | <0.001 (−0.38) |
| BDI | 95 | 12.61 | ± 11.51 | <0.001 (−0.29) |
| Without urticaria | ||||
| EQ5D | 464 | 0.91 | ± 0.16 | <0.001 (−0.20) |
| DLQI | 464 | 3.60 | ± 5.57 | <0.001 (−0.38) |
| BDI | 421 | 5.54 | ± 7.33 | <0.001 (−0.29) |
*Mann–Whitney U-test.
Discussion
Our results showed a significant correlation of allergies and/or urticaria with reduced QoL and a higher depression rate for these patients as previous studies already claimed for urticaria and allergic rhinitis.15–17 A study from 2019 stated that nearly one out of three patients with chronic urticaria had at least one underlying psychiatric disorder.15 Interestingly, 16% of our patients collective suffered from mild to severe depression, which is higher compared to the 1-year prevalence in Germany. Jacobi et al. showed in 2016 that the 1-year prevalence of depression in adults is around 8.2%, in contrast to the lifetime prevalence which is around 17.1%.21,22 Nevertheless, the number of depressions in our patient collective, measured over a period of 7 months, is higher compared to the whole population in Germany over 1 year. One bias might be that our survey took place during the winter period, having a higher prevalence due to the “winter blues,” but still the difference is striking.23 Furthermore, the most common allergies in our patient collective were pollen and food allergies, which is concordant with the literature,24,25 as well as the higher prevalence of allergies in women as our collective significantly showed more often over three allergies and more often allergies against drugs and food in women.26 Especially, allergies against wasp/bee venom, food/food additives, drugs, as well as urticaria were significantly more stressful for the study group. For wasp/bee venom allergies, it has already been shown that specific immunotherapy can improve the QoL and that it represents a severe allergy with one-third of the patients showing serious life-threatening symptoms.9 Furthermore a recent study from 2020—AWARE study—showed that antihistamines can improve the QoL of patients suffering from resistant chronic spontaneous urticaria.27 In contrast to our single-center study, the AWARE study was conducted globally. In addition, other limitations are that we only analyzed self-reported previous allergy diagnoses without evaluation of the current therapy. Nevertheless, analyzing the five different dimensions of the EQ5D-3L in more detail, especially for the dimension of pain/discomfort as well as anxiety/depression, our patient collective showed more often level three compared to the other dimensions indicating having extreme problems, especially regarding mental health and not in mobility/self-care or usual activities. This again reflects the results of our study showing a significant correlation of depression and lower QoL with allergies and urticaria. In conclusion, a standardized questionnaire for evaluating the mental health status of patients with allergies and/or urticaria might be beneficial to be implemented as a regular screening method, as it can facilitate early diagnosis of mental health disorders and thus prevent the socioeconomic consequences as psychiatric disorders are the most common reason for incapacity to work.28 Furthermore, it might be a future investigative task if regular patient training—teaching how to deal with allergies and urticaria including mental training—can improve the QoL and ameliorate the depression rate of patients suffering from these diseases like it is already implemented in the therapy for atopic dermatitis in Germany.
Declaration of Conflicting Interests
The author(s) declared no potential conflicts of interest with respect to the research, authorship, and/or publication of this article.
Funding
The author(s) received no financial support for the research, authorship, and/or publication of this article.
REFERENCES
1. Pawankar R, Canonica GW, Holgate ST, Lockey RF. White book on allergy 2011–2012 executive summary. (Milwaukee, Wisconsin: World Allergy Organization), 2011–2012.
2. Uzzaman A, Cho SH. Chapter 28: Classification of hypersensitivity reactions. Allergy Asthma Proc. 2012;33(Suppl 1):96–99. 10.2500/aap.2012.33.3561
3. Averbeck M, Gebhardt C, Emmrich F, Treudler R, Simon JC. Immunologic principles of allergic disease. J Dtsch Dermatol Ges. 2007;5(11):1015–1028. 10.1111/j.1610-0387.2007.06538.x
4. Ring J, Messmer K. Incidence and severity of anaphylactoid reactions to colloid volume substitutes. Lancet. 1977;1(8009):466–469. 10.1016/S0140-6736(77)91953-5
5. Bloom B, Jones LI, Freeman G. Summary health statistics for U.S. children: National Health Interview Survey, 2012. Vital Healt stat 10. 2013 Dex;(258):1-81. Table 2.
6. Gupta RS, Springston EE, Warrier MR, Smith B, Kumar R, Pongracic J, et al. The prevalence, severity, and distribution of childhood food allergy in the United States. Pediatrics. 2011;128(1):e9–e17. 10.1542/peds.2011-0204
7. Worm M, Jappe U, Kleine-Tebbe J, Schafer C, Reese I, Saloga J, et al. Food allergies resulting from immunological cross-reactivity with inhalant allergens: guidelines from the German Society for Allergology and Clinical Immunology (DGAKI), the German Dermatology Society (DDG), the Association of German Allergologists (AeDA) and the Society for Pediatric Allergology and Environmental Medicine (GPA). Allergo J Int. 2014;23(1):1–16. 10.1007/s40629-014-0004-6
8. Neugut AI, Ghatak AT, Miller RL. Anaphylaxis in the United States: an investigation into its epidemiology. Arch Intern Med. 2001;161(1):15–21. 10.1001/archinte.161.1.15
9. Oude Elberink JN, De Monchy JG, Van Der Heide S, Guyatt GH, Dubois AE. Venom immunotherapy improves health-related quality of life in patients allergic to yellow jacket venom. J Allergy Clin Immunol. 2002;110(1):174–182. 10.1067/mai.2002.125827
10. Clark S, Long AA, Gaeta TJ, Camargo CA. Multicenter study of emergency department visits for insect sting allergies. J Allergy Clin Immunol. 2005;116(3):643–649. 10.1016/j.jaci.2005.06.026
11. Schafer T, Ring J. Epidemiology of urticaria. Monogr Allergy. 1993;31:49–60.
12. Antia C, Baquerizo K, Korman A, Bernstein JA, Alikhan A. Urticaria: a comprehensive review: epidemiology, diagnosis, and work-up. J Am Acad Dermatol. 2018;79(4):599–614. 10.1016/j.jaad.2018.01.020
13. Wertenteil S, Strunk A, Garg A. Prevalence estimates for chronic urticaria in the United States: a sex-and age-adjusted population analysis. J Am Acad Dermatol. 2019;81(1):152–156. 10.1016/j.jaad.2019.02.064
14. Torres MJ, Blanca M, Fernandez J, Romano A, Weck A, Aberer W, et al. Diagnosis of immediate allergic reactions to beta-lactam antibiotics. Allergy. 2003;58(10):961–972. 10.1034/j.1398-9995.2003.00280.x
15. Quigley J, Sanders GM. Food allergy in patients seeking mental health care: what the practicing psychiatrist should know. Curr Psychiatry Rep. 2017;19(12):99. 10.1034/j.1398-9995.2003.00280.x
16. Konstantinou GN, Konstantinou GN. Psychiatric comorbidity in chronic urticaria patients: a systematic review and meta-analysis. Clin Transl Allergy. 2019;9:42. 10.1186/s13601-019-0278-3
17. Tat TS. Higher levels of depression and anxiety in patients with chronic urticaria. Med Sci Monit. 2019;25:115–120. 10.12659/MSM.912362
18. Szende A, Janssen B, Cabases J, editors. Self-reported population health: an international perspective based on EQ-5D. Dordrecht; 2014.
19. Finlay AY, Khan GK. Dermatology life quality index (DLQI)–a simple practical measure for routine clinical use. Clin Exp Dermatol. 1994;19(3):210–216. 10.1111/j.1365-2230.1994.tb01167.x
20. Beck AT, Ward CH, Mendelson M, Mock J, Erbaugh J. An inventory for measuring depression. Arch Gen Psychiatry. 1961;4:561–571. 10.1001/archpsyc.1961.01710120031004
21. Jacobi F, Hofler M, Strehle J, Mack S, Gerschler A, Scholl L, et al. [Erratum to: mental disorders in the general population. Study on the health of adults in Germany and the additional module mental health (DEGS1-MH)]. Nervenarzt. 2016;87(1):88–90. 10.1007/s00115-015-4458-7
22. Jacobi F, Hofler M, Strehle J, Mack S, Gerschler A, Scholl L, et al. [Mental disorders in the general population: study on the health of adults in Germany and the additional module mental health (DEGS1-MH)]. Nervenarzt. 2014;85(1):77–87. 10.1007/s00115-013-3961-y
23. Melrose S. Seasonal affective disorder: an overview of assessment and treatment approaches. Depress Res Treat. 2015;2015:178564. 10.1155/2015/178564
24. Savage J, Johns CB. Food allergy: epidemiology and natural history. Immunol Allergy Clin North Am. 2015;35(1):45–59. 10.1016/j.iac.2014.09.004
25. Kakli HA, Riley TD. Allergic rhinitis. Prim Care. 2016;43(3):465–475. 10.1016/j.pop.2016.04.009
26. Kelly C, Gangur V. Sex disparity in food allergy: evidence from the PubMed database. J Allergy (Cairo). 2009;2009:159845. 10.1155/2009/159845
27. Maurer M, Costa C, Gimenez Arnau A, Guillet G, Labrador-Horrillo M, Lapeere H, et al. Antihistamine-resistant chronic spontaneous urticaria remains undertreated: 2-year data from the AWARE study. Clin Exp Allergy. 2020;50(10):1166–1175. 10.1111/cea.13716
28. Berufsunfähigkeit – Meistens gibt die Seele auf ÄrzteZeitung. 2017.
Supplementary Tables
Correlation between urticaria and hymenopteran venom allergies.
| Allergies against | Bee venom | Wesp venom |
|---|---|---|
| With urticaria (n = 116) | ||
| n | 8 | 13 |
| Percentage | 6.9% | 11.2% |
| Without urticaria (n = 464) | ||
| n | 68 | 104 |
| Percentage | 14.7% | 22.4% |
| Total population (n = 580) | ||
| n | 76 | 117 |
| Percentage | 13.1% | 11.1% |
| p-value* | 0.027 | 0.007 |
*Pearson-Chi Quadrat test.
Correlation between allergies and health insurance.
| Health insurance | Allergies | No allergies |
|---|---|---|
| Statutory insurance (n = 512) | ||
| n | 465 | 47 |
| Percentage | 90.8% | 9.2% |
| Private insurance (n = 56) | ||
| n | 49 | 7 |
| Percentage | 87.5% | 12.5% |
| Total population (n = 580) | ||
| n | 514 | 54 |
| Percentage | 90.5% | 9.5% |
| p-value* | 0.421 |
*Pearson-Chi-Quadrat test
Total number of patients categorized in EQ5D-3L dimensions and levels.
| Level 1 n (%) | Level 2 n (%) | Level 3 n (%) | |
|---|---|---|---|
| Mobility | 526 (90.1) | 56 (9.6) | 2 (0.3) |
| Self-care | 574 (98.1) | 10 (1.7) | 1 (0.2) |
| Usual activities | 435 (74.9) | 139 (23.9) | 7 (1.2) |
| Pain/discomfort | 302 (52.6) | 238 (41.5) | 34 (5.9) |
| Anxiety/depression | 399 (68.9) | 159 (27.5) | 21 (3.6) |
Correlation between the QoL and depression with health insurance.
| Scores | Statutory insurance | Private insurance | p-value |
|---|---|---|---|
| BDI (n = 524) | |||
| n | 470 | 54 | <0.001 |
| Mean ± SD | 7.44 (± 8.94) | 2.48 (± 4.61) | |
| DLQI (n = 590) | |||
| n | 532 | 58 | <0.001 |
| Mean ± SD | 4.93 (± 6.33) | 2.59 (± 4.77) | |
| EQ5D (n = 590) | |||
| n | 532 | 58 | <0.001 |
| Mean ± SD | 0.89 (± 0.18) | 0.95 (± 0.13) |
*Mann-Whitney U-test.