
Download
RESEARCH Article
Persistence of airborne tree pollen from the Cupressaceae family during the last decade in the city of Bahia Blanca
German D. Ramona*, Miguel Felixb, c, Laura B. Barrionuevoa, Graciela Maria Benedettid, Valeria Soledad Duvald, Emanuel Vanegasb, c, Ivan Cherrez-Ojedab, c
aDepartment of Allergy and Immunology, Instituto de Alergia e Inmunología del Sur, Hospital Italiano Regional del Sur, Bahía Blanca, Argentina
bDepartment of Medicine, Universidad Espíritu Santo, Samborondón, Ecuador
cRespiralab Research Group, Guayaquil, Ecuador
dDepartment of Allergy and Immunology, Universidad Nacional del Sur (UNS), Bahía Blanca, Argentina
Abstract
Airborne pollen is a major contributor to allergic respiratory diseases. However, the literature on patterns and seasonality of specific pollen types mainly comes from northern hemisphere and developed regions, limiting our ability to extrapolate these findings to other geographical locations. With this research letter, our aim is to contribute to the current knowledge of aerobiology by analyzing the decade-long patterns of airborne tree pollen in the city of Bahia Blanca, Argentina. In general, we found late winter to early spring as the period with the highest Cupressaceae pollen counts. In 2020, the average pollen count during July through September was 78.81 (SD 79.70), the highest recorded during the last 10 years. These months had varying pollen concentrations from moderate (15–89 grains/m3 of air) to high (90–1499 grains/m3 of air). Regardless of such variation, August had consistently been the month with the highest peak concentrations from 2010 to 2020 (61.2, SD 57.3), followed by September (27.1, SD 20.3). We did not find any month with very high (˃1500 grains/m3 of air) peak concentration. Further studies need to be done to expand our knowledge on aerobiology to characterize specific pollen sub-types and determine the exact allergenic potential of airborne pollen in different regions.
Key words: airborne pollen, Argentina, cupressaceae, tree, South America
*Corresponding author: Germán D. Ramón, MD, 25 de Mayo 44, Bahía Blanca, B8000JRB, Buenos Aires, Argentina. Email address: [email protected]
Received 8 August 2021; Accepted 28 December 2021; Available online 1 March 2022
Copyright: Ramon GD, et al.
License: This open access article is licensed under Creative Commons Attribution 4.0 International (CC BY 4.0). http://creativecommons.org/licenses/by/4.0/
Introduction
Airborne pollen is a major contributor to allergic respiratory diseases, such as rhinitis, conjunctivitis, and asthma. However, despite the increasing attention that pollen has received due to its strong allergenic potential to cause or exacerbate allergic diseases, the literature on patterns and seasonality of specific pollen types mainly comes from the northern hemisphere and developed regions.1,2 This poses a unique challenge in our ability to extrapolate these findings to the clinical context in other geographical locations.
In the case of tree pollen, there are many species with allergenic potential. One of them is the Cupressaceae family, which includes over 140 species with non-deciduous foliage. These species tend to grow in warm temperate regions of the northern hemisphere, and have seen an increased pollination period due to global warming.3 Certain species within the Cupressaceae genera have been acknowledged to contain clinically relevant allergens, as is the case of Cupressus sempervirens (Mediterranean cypress) and Cupressus arizonica (Arizona cypress), with sensitization rates in one study ranging from 2.4 to 35.4% in the general population.4,5
To our knowledge, few studies have been conducted in Argentina that determines and characterizes the patterns of specific types of airborne pollen. With this clinical communication, we aim to contribute to the current knowledge of aerobiology by analyzing the decade-long patterns of airborne tree pollen in the city of Bahía Blanca, Argentina. Our goal is that the data presented can aid clinicians and patients with allergic conditions that may be sensitized to Cupressaceae tree pollen, and encourage further studies needed in the field.
Materials and Methods
An observational study was conducted to analyze the patterns and seasonality of Cupressaceae airborne pollen in the city of Bahia Blanca, Argentina. The data analyzed contained the daily pollen concentration expressed per cubic meter of air from January 2010 to December 2020. The sample was collected using Rotorod® impact samplers at a minimum of 3 days per week. The data were categorized according to the National Allergy Bureau (NAB) chart depicted in Table 1.6 The category for each month was established by the highest daily peak concentration, and categorized accordingly (Figure 1).
Table 1 Categories of airborne tree pollen concentration according to the National Allergy Bureau.
| Concentration (grain/m3 of air) | Category |
|---|---|
| 0 | Absent |
| 1–14 | Low |
| 15–89 | Moderate |
| 90–1499 | High |
| ˃1500 | Very High |
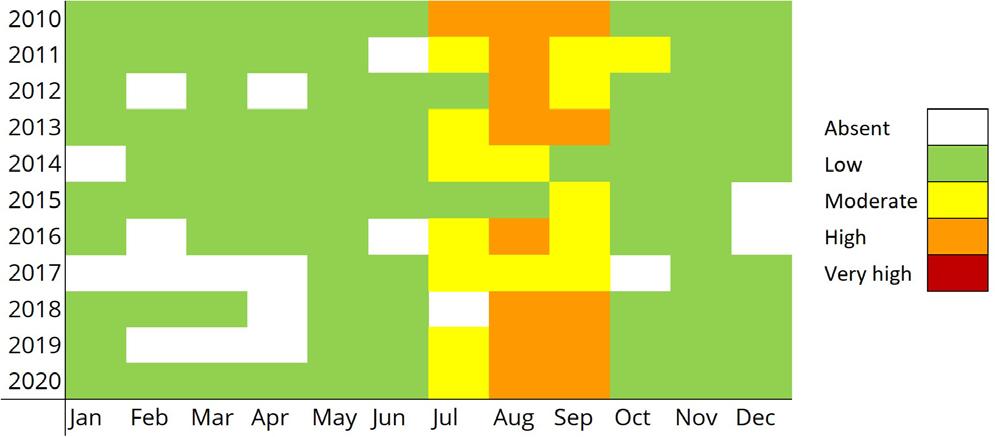
Figure 1 Peak monthly Cupressaceae airborne pollen concentration in the city of Bahía Blanca, Argentina from 2010 to 2020.
Notes: Please refer Table 1 for a detailed description of the cutoff values (expressed in grain/m3 of air) for each category. Of note, only 15% of the months studied did not register a detectable concentration of Cupressaceae airborne pollen during the study period.
Results
In general, it was found that late winter to early spring is the period with the highest Cupressaceae pollen counts in the city of Bahia Blanca, Argentina. At least some concentration of pollen was observed in 85% of all months studied. In 2020, the average pollen count during July through September was 78.81 (SD 79.70), the highest recorded during the last 10 years. These months had varying concentrations from moderate (15–89 grains/m3 of air) to high (90–1499 grains/m3 of air). Regardless of such variation, August had consistently been the month with the highest peak concentrations from 2010 to 2020 (61.2, SD 57.3), followed by September (27.1, SD 20.3). In contrast, the rest of the months had absent to low (1–14 grains/m3 of air) concentrations. We did not find any month with a very high (˃1500 grains/m3 of air) peak concentration.
Discussion
These findings align with reports from other locations. For instance, a publication proposing an aerobiological and allergenic analysis of Cupressaceae pollen in Granada reported the highest counts during the winter season. Furthermore, both temperature and relative humidity inversely correlated with pollen emission, while rainfall before flowering precipitated pollen production.7 Interestingly though, despite July being the coldest and driest month in Bahía Blanca, it was in the month of August with the highest peak concentrations, meaning that other meteorological variables are likely to explain such findings.
New studies are emerging which may provide initial insight to better understand the seasonality of pollen in other regions. A previous study on different trees, grasses, and weeds pollen across four cities in Argentina found that there are differences in peak counts and monthly concentrations related to the type of pollen and city, which may reflect the geographical and botanical characteristics unique to each place.2 It is likely then that allergic diseases may follow seasonal patterns, and establishing them can be beneficial to both patients and healthcare providers involved in treating these conditions. One example is the case of allergen immunotherapy (AIT) for seasonal allergic rhinoconjunctivitis, where the determination of relevant local pollen exposure is used to define a therapeutic time window.
Although, not an exact representation of the antigenic challenge an individual may face, airborne pollen counters can provide us with an approximate exposure with evidence, suggesting that symptoms of some allergic diseases may be correlated to pollen counts.2 However, to our knowledge, there is no clear consensus yet on specific cut-off values for airborne pollen to trigger or cause allergic diseases. For instance, one study found that concentrations of weed pollen as low as 6–9 grains/m3 were enough to trigger symptoms in children.8 This is in contrast to another study where tree pollen concentrations above 23 grains/m3 were found to exacerbate symptoms in adults with a history of atopy.9 It would appear then that cut-off values depend on the type of pollen, patient, and allergic disease studied, and are also related to the molecular allergenic potential of each specific pollen subtype.4
There are some limitations to the findings of the research that are worth mentioning. The individual subtypes of Cupressaceae were not assessed, and thus the exact allergenic potential of the pollen counts described in the present study could not be determined. In this regard, the morphological classification of the pollen grain by microscopy can determine if it belongs to the Cupressaceae family, but it cannot be identified at the genus level because it belongs to the stenopollen family (taxonomic groups characterized by presenting little variation in the pollen types). These pollen grains may belong to the following species found in the trees of the city of Bahía Blanca: Cupressus sempervirens (Italian cypress, Mediterranean cypress), Cupressus arizonica (Arizona cypress), Cupressus macrocarpa (Monterey cypress, Macrocarpa cypress, Lambertian cypress), Thuja occidentalis (thuja), Chamaecyparis lawsoniana (false cypress), and Juniperus sp. (juniper). Also, there are specific geographical characteristics to the city Bahía Blanca (Argentina) that may limit the extrapolation of the findings to other regions. However, to the best of our knowledge, the present study is among the first to assess the decade-long pattern of Cupressaceae airborne pollen in an Argentinian city.
Conclusion
In conclusion, July to September represents the period with the highest peak concentrations of Cupressaceae pollen in the city of Bahia Blanca, a consistent finding during the last decade. It was also foumd that low amounts of Cupressaceae pollen is present most of the time throughout the calendar year. Further studies need to be conducted to expand our knowledge on aerobiology, characterize specific pollen subtypes, and determine the exact allergenic potential of airborne pollen in different regions.
Acknowledgements
We want to express our gratitude to Universidad Espiritu Santo for their continuous support in the field of research.
Conflict of interest
The authors declare no potential conflicts of interest with respect to research, authorship, and/or publication of this article.
REFERENCES
1. De Weger LA, Bergmann KC, Rantio-Lehtimäki A, Dahl Å, Buters J, Déchamp C, et al. Impact of pollen. In: Allergenic pollen. Springer, Dordrecht; 2013, pp. 161–215. 10.1007/978-94-007-4881-1_6
2. Ramon GD, Vanegas E, Felix M, Barrionuevo LB, Kahn AM, Bertone M, et al. Year-long trends of airborne pollen in Argentina: more research is needed. World Allergy Organ. 2020;13: 1–4. 10.1016/j.waojou.2020.100135
3. Charpin D, Calleja M, Lahoz C, Pichot C, Waisel Y. Allergy to cypress pollen. Allergy. 2005;60:293–301. 10.1111/j.1398-9995.2005.00731.x
4. Asam C, Hofer H, Wolf M, Aglas L, Wallner M. Tree pollen allergens-an update from a molecular perspective. Allergy. 2015;70:1201–1211. 10.1111/all.12696
5. Aceituno E, Del Pozo V, Minguez A, Arrieta I, Cortegano I, Cardaba B, et al. Molecular cloning of major allergen from Cupressus arizonica pollen: cup a 1. Clin Exp Allergy. 2000;30:1750–1758. 10.1046/j.1365-2222.2000.00949.x
6. American Academy of Allergy, Asthma & Immunology. NAB pollen counts: reading the charts. Available from: https://www.aaaai.org/global/nab-pollen-counts/reading-the-charts
7. Díaz de la Guardia C, Alba Sánchez MF, de Linares Fernández C, Nieto-Lugilde D, López Caballero J. Aerobiological and allergenic analysis of Cupressaceae pollen in Granada (Southern Spain). J Investig Allergol Clin Immunol. 2006.
8. DellaValle CT, Triche EW, Leaderer BP, Bell ML. Effects of ambient pollen concentrations on frequency and severity of asthma symptoms among asthmatic children. Epidemiol Camb Mass. 2012;23:55–63. 10.1097/EDE.0b013e31823b66b8
9. Comtois P, Gagnon L. Pollen concentration and frequency of pollinosis symptoms-method of determination of the clinical threshold. Rev Francaise Allergol Immunol Clin. 1988;28:279–286. 10.1016/S0335-7457(88)80046-7