
Download
ORIGINAL ARTICLE
Serum EDN as a novel biomarker for severe eosinophilic adult asthma
Şeyma Özdena*, Aysun Aynacıa, İsmet Buluta, Şebnem Korkmazb
aUniversity of Health Sciences, Süreyyapaşa Chest Diseases and Thoracic Surgery Training and Research Hospital, Department of Immunology and Allergy, Istanbul, Türkiye
bMavi Laboratories Group, Department of Biochemistry, İstanbul, Türkiye
Abstract
Background: Eosinophilic inflammation is a major pathophysiological mechanism in severe asthma (SA). However, a reliable serum biomarker reflecting this type of inflammation has not yet been identified. Therefore, in this study, we aimed to investigate whether serum levels of eosinophil-derived neurotoxin (EDN) could serve as a biomarker for predicting the diagnosis of SA in adult patients with asthma.
Methods: A total of 89 patients, including 52 with SA and 37 with nonsevere asthma (NSA), were included in the study, all having PBEC ≥ 150 cells/µL. The relationships between serum EDN and serum eosinophilic cationic protein (ECP) levels with peripheral blood eosinophil count (PBEC), as well as with clinical and demographic parameters, were assessed. In addition, the clinical validity of serum EDN and PBEC levels in predicting the SA phenotype was evaluated.
Results: A correlation analysis among PBEC, serum EDN, and serum ECP levels revealed statistically significant positive correlations: between PBEC and serum ECP (p<0.001), PBEC and serum EDN (p<0.001), and serum ECP and serum EDN (p=0.002). Serum EDN and PBEC levels were significantly higher in the SA group compared to the NSA group (225.40 [0.001–588.76] vs. 380.05 [0.001–1920.45], p<0.001; 290 [160–820] vs. 335 [170–2070], p=0.003, respectively). Regarding spirometric parameters, FEV1 (mL and %), FVC (mL and %), and FEF25–75 (mL and %) values were significantly lower in the SA group compared to the NSA group. In the receiver operating characteristic (ROC) curve analysis evaluating the predictive value of serum EDN levels for identifying the SA phenotype, a sensitivity of 69% was observed. In univariate analysis, both serum EDN and PBEC levels were significantly associated with SA. However, multivariate analysis demonstrated that only serum EDN levels remained a statistically significant independent predictor of the SA phenotype.
Conclusions: Serum EDN emerged as an independent predictor of the SA phenotype and demonstrated superior diagnostic performance compared with conventional eosinophilic markers. These findings highlight its potential as a promising biomarker for identifying SA and reflecting underlying type 2 airway inflammation.
Key words: severe asthma, type 2 inflammation, eosinophil-derived neurotoxin
*Corresponding author: Şeyma Özden, University of Health Sciences, Süreyyapaşa Chest Diseases and Thoracic Surgery Training and Research Hospital, Department of Immunology and Allergy, Istanbul, Türkiye. Email address: [email protected]
Received 7 January 2026; Accepted 12 March 2026; Available online 1 July 2026
Copyright: Özden Ş, et al.
This open access article is licensed under Creative Commons Attribution 4.0 International (CC BY 4.0). http://creativecommons.org/licenses/by/4.0/
Introduction
Asthma is a heterogeneous disease characterized by chronic airway inflammation, affecting approximately 300 million individuals worldwide, and remains a major global health concern, accounting for an estimated 1,000 deaths per day.1 It is marked by variable airflow limitation and fluctuating respiratory symptoms, such as shortness of breath, wheezing, chest tightness, and/or cough, with prevalence rates reported to range from 1% to 29% across different populations.2,3 Recent studies have demonstrated that various immune cells and mediators play a pivotal role in the pathophysiology of asthma and other allergic diseases. In light of these advancements, a paradigm shift has occurred in which the development of therapeutic strategies now encompasses not only the clinical manifestations of the disease but also its underlying pathophysiological mechanisms.4,5 Eosinophils are multifunctional effector cells that play a critical role in the allergic process through multiple pathophysiological pathways. Upon eosinophil activation, the extracellular release of four highly basic granule proteins occurs. These proteins include: major basic protein (MBP), eosinophil peroxidase (EPO), eosinophilic cationic protein (ECP), and eosinophil-derived neurotoxin (EDN).5 For many years, research on eosinophil granule proteins predominantly concentrated on the potential of ECP as a biomarker for allergic diseases. However, in the past decade, numerous studies have been conducted on EDN, and in some of these studies, the two proteins have been directly compared, revealing significant similarities. Both biomarkers (ECP and EDN) belong to the ribonuclease (RNase) family expressed in eosinophils and are almost exclusively released by these cells. This characteristic makes ECP and EDN highly reliable biomarkers for eosinophil activity.6 The relatively weaker electrical charge of EDN compared to ECP facilitates its more efficient recovery from analytical instruments and cell surfaces. In addition, its higher secretion efficiency from eosinophils and its long-term stability under frozen conditions (exceeding 1 year) may constitute critical advantages, enhancing its potential as a reliable biomarker in the context of disease.7,8 Several studies have demonstrated that EDN levels may be associated with asthma severity and airway hyperresponsiveness.9,10 Notably, elevated EDN levels have been observed during asthma exacerbations.11 Moreover, prolonged exposure to high concentrations of EDN has been shown to exert deleterious effects on surrounding tissues, suggesting that it may represent a potential risk factor for the progression of disease pathology. In this study, we aimed to investigate the potential utility of serum EDN levels as a biomarker for assessing asthma severity.
Material and Methods
Study populations
A total of 89 Turkish adult asthma patients were included in the study, comprising 52 with severe asthma (SA) and 37 with nonsevere asthma (NSA), all having a peripheral blood eosinophil count (PBEC) value of ≥150 cells/µL. The diagnosis of asthma was established by allergy specialists in accordance with the Global Initiative for Asthma (GINA) guidelines.1 Participants were categorized into SA and NSA groups based on the International European Respiratory Society/American Thoracic Society guidelines.12 Patients with any known underlying respiratory conditions other than asthma were excluded from the study. Written informed consent was obtained from all participants prior to enrollment. The study protocol was approved by the local ethics committee. (Approval identification number and date: 152, 22.11.2023)
The demographic characteristics (age, sex, height, weight, smoking history, age at asthma onset, and asthma duration), laboratory parameters (PBEC, serum EDN, serum ECP, serum total IgE, and spirometry test (SFT) values), and comorbidities [allergic rhinitis, nasal polyps, atopy, nonsteroidal anti-inflammatory drug exacerbated respiratory disease (N-ERD)] of the patients were recorded from the hospital database. Atopy was defined as the presence of at least one positive reaction to 18 common inhalant allergens, as assessed by a skin prick test (Lofarma Co., Italy). A skin prick test was considered positive when the mean wheal diameter was ≥3 mm greater than that of the negative control after 15–20 minutes of application. The diagnosis of nasal polyps was made based on paranasal sinus computed tomography or rhinoscopic findings. The patient’s medical history was reviewed to determine whether they had previously undergone surgery for nasal polyps, and if so, the number of surgeries was recorded. At the time of the first visit, an SFT was performed in addition to the asthma control test (ACT), and the results were recorded. Patients who had no history of hypereosinophilic disease (including hypereosinophilic syndrome, eosinophilic granulomatosis with polyangiitis, and eosinophilic esophagitis/gastritis) and any subject receiving oral corticosteroids or anti-eosinophilic therapies within the past 1 and 6 months, respectively, were excluded.
Measurement of serum EDN and ECP
Serum samples were collected at the initial visit and stored at –80°C; they were thawed immediately before use during the initial evaluation. RNASE2 levels were measured by using ELİSA (Human RNase A family, 2 (liver, EDN), RNASE2 ELİSA kit; Bioassay Technology Laboratory (BT Lab), Korain Biotech, Zhejiang, China) according to their respective manufacturers’ protocols. ECP levels in the serum were measured, using the automated chemiluminescent immunoassay system (Immulite 2000 analyzer, Siemens®) immunologic test analyzer, with the solid phase, two-site, chemiluminescent immunometric method.
Statistical analysis
The statistical analyses of the study were performed using the trial version of the SPSS 22.0 software package (SPSS Inc., Chicago, IL). The conformity of quantitative variables to a normal distribution was assessed using the Kolmogorov–Smirnov and Shapiro–Wilk tests. Comparisons between independent groups were conducted using the independent samples t-test for normally distributed variables and the Mann–Whitney U test for nonnormally distributed variables. The relationships between categorical variables were analyzed using the chi-square test. Simple linear regression analysis was performed to establish a linear model between dependent and independent variables. Logistic regression analyses identified the contributions of continuous and dichotomous variables to SA. Descriptive statistics for normally distributed quantitative variables were expressed as mean ± standard deviation, while those for nonnormally distributed quantitative variables were presented as median (min–max). Descriptive statistics for categorical variables were expressed as frequency (%). A p-value of <0.05 was considered statistically significant.
Results
Demographic and clinical characteristics
A total of 89 patients were analyzed, with a mean age of 40.76 ± 12.59 years; 74.2% were identified as female. The mean body mass index (BMI) was calculated as 27.35 ± 5.56 kg/m2, and 29.2% of the patients were classified as obese (BMI≥30 kg/m2). The mean age at asthma onset was determined to be 30.44 ± 13.68 years. Baseline clinical, laboratory, and pulmonary function parameters are detailed in Table 1.
Table 1 Clinical, laboratory, and demographic characteristics of the 89 patients.
| Age, years, mean±SD | 40.76 ± 12.59 |
|---|---|
| Gender, female, n (%) | 66 (74.2) |
| BMI, kg/m2, mean±SD | 27.35 ± 5.56 |
| Serum EDN, ng/mL, mean±SD | 439.228 ± 403.72 |
| PBEC cells/μL, mean±SD | 395.05 ± 286.46 |
| Serum ECP, µg/L, mean±SD | 111.58 ± 65.14 |
| Age at asthma onset, years, mean±SD | 30.44 ± 13.68 |
| Asthma duration, mean±SD | 10.14 ± 8.22 |
| ACT, mean±SD | 15.32 ± 5.19 |
| Total IgE, IU, median (min–max) | 171 (17–4854) |
| FEV1, mL, mean±SD | 2740.11 ± 991.22 |
| FEV1, %, mean±SD | 88.96 ± 22.61 |
| FVC, mL, mean±SD | 3347.84 ± 1125.31 |
| FVC, %, mean±SD | 93.18 ± 17.73 |
| FEF25–75, mL, mean±SD | 3172.75 ± 1911.70 |
| FEF25–75, %, mean±SD | 79.31 ± 31.41 |
BMI: Body mass index, EDN: Eosinophil-derived neurotoxin, PBEC: Peripheral blood eosinophil count, ECP: eosinophil cationic protein, ACT: Asthma control test,IgE: immunoglobulin E, FEV1: Forced expiratory volume in 1 second, FVC: Forced vital capacity, FEF25–75: Forced expiratory flow between 25% and 75% of forced vital capacity.
Subgroup analysis of NSA and SA patients
There was no significant difference between the NSA and SA groups regarding demographic data such as age, sex, age at asthma onset, disease duration, and BMI. However, when laboratory parameters were evaluated, serum EDN and PBEC levels were found to be significantly higher in the SA group compared to the NSA group (225.40 [0.001–588.76] vs. 380.05 [0.001–1920.45], p<0.001; 290 [160–820] vs. 335 [170–2070], p=0.003, respectively). No statistically significant difference was observed between the groups regarding serum total IgE and serum ECP levels. In addition, the SA group had lower ACT scores and a higher number of asthma exacerbations requiring at least 3 days of systemic corticosteroid (SS) use within the past year. When spirometric parameters were analyzed, FEV1 (mL and %), FVC (mL and %), and FEF25–75 (mL and %) values were significantly lower in the SA group compared to the NSA group. When examining comorbidities, there was no statistically significant difference between the two groups regarding AR, N-ERD, atopy, obesity, and the presence of nasal polyps. In addition, the smoking history and the number of previous nasal polyp surgeries, if performed, were similar between the two patient groups. The comparison of the results of the subgroups is shown in Table 2.
Table 2 Comparison of clinical, demographic, and laboratory findings between patients with severe and nonsevere asthma.
| NSA (n=37) | SA (n=52) | P value | |
|---|---|---|---|
| Age, years, mean±SD | 39.16 ± 11.61 | 41.90 ± 13.23 | 0.314* |
| Asthma duration, years, median (min–max) | 6 (1-44) | 9 (1-34) | 0.180** |
| Age at asthma onset, years, mean±SD | 29.59 ± 13.28 | 31.05 ± 14.05 | 0.622* |
| Gender, female, n(%) | 25 (67,6) | 41 (78.8) | 0.341*** |
| BMI, kg/m2, mean±SD | 27.59 ± 6.46 | 27.18 ± 4.91 | 0.742* |
| Serum EDN, ng/mL, median (min–max) | 225.40 (0-588.76) | 380.05 (0-1920.45) | <0.001** |
| PBEC cells/μL, median (min–max) | 290 (160-820) | 335 (170-2070) | 0.030** |
| Serum ECP, µg/L, median (min–max) | 89 (21-472) | 109 (12-200) | 0.175** |
| Total IgE, IU, median (min–max) | 183 (20-3854) | 145 (17-1576) | 0.365** |
| ACT, median (min–max) | 19 (12-25) | 11 (5-24) | <0.001** |
| Number of exacerbations (in the past year), median (min–max) | 0 (0-3) | 0 (0-15) | <0.001** |
| FEV1, mL, median (min–max) | 3020 (1520-5840) | 2410 (700-5590) | 0.005** |
| FEV1, %, mean±SD | 95.64 ± 15.87 | 84.21 ± 25.48 | 0.018* |
| FVC, mL, median (min–max) | 3570 (1870-6760) | 2940 (1450-6090) | 0.005** |
| FVC, %, mean±SD | 98.63 ± 16.55 | 89.40 ± 17.68 | 0.015* |
| FEF25–75, mL, median (min–max) | 3190 (1630-15100) | 2770 (310-7930) | 0.002** |
| FEF25–75, %, mean±SD | 88.94 ± 24.50 | 73.01 ± 33.96 | 0.021* |
| Presence of atopy, n (%) | 26 (70.3) | 36 (69.2) | 0.916*** |
| Presence of obesity, n (%) | 12 (34.3) | 14 (27,5) | 0.661*** |
| Presence of AR, n (%) | 24 (64.9) | 30 (57.7) | 0.644*** |
| Presence of N-ERD, n (%) | 2 (5.4) | 3 (5.8) | 0.659*** |
| Presence of nasal polyps, n(%) | 8 (21.6) | 9 (17.3) | 0.813*** |
| Number of surgeries due to nasal polyps, n (%) | 0 (0-2) | 0 (0-2) | 0.517*** |
| Smoking history, n (%) | 0.341*** | ||
| Nonsmoker | 24 (64.9) | 30 (57.7) | |
| Current smoker | 10 (27) | 12 (23.1) | |
| Ex-smoker | 3 (8.1) | 10 (19.2) |
*: Independent sample t-test, **: Mann–Whitney U test, ***: Chi Square Test.
BMI: Body mass index, EDN: Eosinophil-derived neurotoxin, PBEC: Peripheral blood eosinophil count, ECP: Eosinophil cationic protein, ACT: Asthma control test, IgE: Immunoglobulin E, FEV1: Forced expiratory volume in 1 second, FVC: Forced vital capacity, FEF25–75: Forced expiratory flow between 25% and 75% of forced vital capacity, AR: Allergic rhinitis, N-ERD: Nonsteroidal anti-inflammatory drug (NSAID)-exacerbated respiratory disease.
The correlation between PBEC, serum ECP, and serum EDN
A correlation analysis between PBEC, serum EDN, and serum ECP levels revealed a statistically significant positive correlation between PBEC and serum ECP (r=0.508, p<0.001), PBEC and serum EDN (r=0.508, p<0.001), as well as between serum ECP and serum EDN (r:0.333, p=0.002).
Serum EDN level as a biomarker of SA
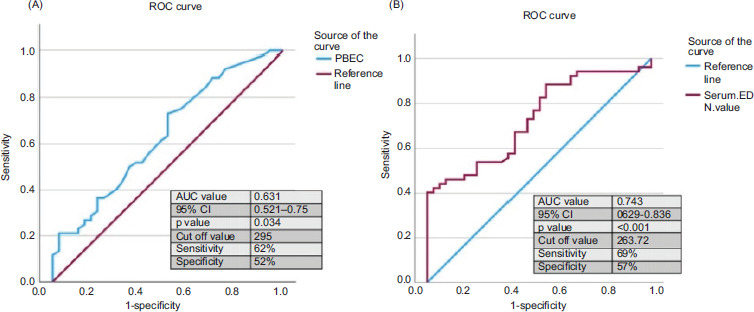
Receiver operating characteristic (ROC) curves of serum EDN levels, serum ECP levels, and PBEC levels were measured to predict the phenotype of SA. Serum EDN levels showed a higher area under the curve (AUC) value with statistical significance (AUC value: 0.743, p<0.001 at the cut-off value of 263.72 ng/mL with 69% of sensitivity and 57% of specificity, Figure 1A). While the serum ECP value was found to be not statistically significant, the PBEC value was significant (AUC value: 0.631, p=0.034 at the cutoff value of 295 cells/µL with 62% of sensitivity and 52% of specificity, Figure 1B). However, the cutoff value determined for serum EDN was found to have higher sensitivity and specificity compared to PBEC. In addition, the predictability of clinical and laboratory parameters for SA was evaluated using univariate and multivariate logistic regression analyses. Serum EDN and PBEC levels were identified as significant parameters associated with SA in the univariate analysis (p< 0.001 and p=0.045, respectively). However, multivariate analysis revealed that only serum EDN levels were a significant parameter for predicting the SA phenotype (Table 3).
Figure 1 ROC curves for the PBEC levels measured in the prediction of severe asthma in the total asthmatics (A). ROC curves for the serum EDN levels in the prediction of severe asthma in the total asthmatics (B). ROC, Receiver operating characteristic; EDN, Eosinophil-derived neurotoxin; AUC, Area under the curve; CI, Confidence interval.
Table 3 Predictability for severe asthma by univariate and multivariate logistic regression analyses.
| Variable | Univariate | Multivariate | ||
|---|---|---|---|---|
| OR (95%CI) | p value | OR (95% CI) | p value | |
| Duration of asthma (years) | 1.010 (0.957–1.066) | 0.720 | - | - |
| Age at asthma onset (years) | 1.008 (0.977–1.041) | 0.068 | - | - |
| Presence of atopy | 1.125 (0.443–2.860) | 0.805 | - | - |
| Presence of N-ERD | 0.949 (0.150–6.004) | 0.956 | - | - |
| Presence of nasal polyps | 0.777 (0.258–2.338) | 0.654 | - | - |
| BMI (kg/m2) | 0.986 (0.911–1.068) | 0.729 | - | - |
| Serum ECP (µg/L) | 1.002 (0.995–1.009) | 0.602 | ||
| PBEC (cells/ µL) | 1.003 (1.000–1.005) | 0.045 | 1.002 (0.998-1.005) | 0.377 |
| Serum EDN (ng/mL) | 1.004 (1.002–1.007) | <0.001 | 1.006 (1.002-1.009) | <0.001 |
BMI: Body mass index, EDN: Eosinophil-derived neurotoxin, PBEC: Peripheral blood eosinophil count, ECP: Eosinophil cationic protein, N-ERD: Nonsteroidal anti-inflammatory drug (NSAID)-exacerbated respiratory disease.
Discussion
Eosinophils are key cellular components in airway inflammation in SA and are associated with persistently elevated type 2 inflammatory markers. As principal effector cells, eosinophils exert their function by releasing granule proteins such as ECP, MBP, EDN, and EPO. These proteins (except for MBP) are localized within the matrix of specific granules and exhibit cytotoxic and anti-infective properties through their RNase activity. In addition, they play a crucial role in lung epithelial damage, mucus hypersecretion, airway remodeling, and inflammatory processes.13 A previous study suggested that serum EDN levels may serve as a biomarker of asthma severity in the pediatric population.14 In another study by Kim et al., involving childhood asthma, serum EDN levels were found to be significantly higher in patients with SA compared to those with NSA, consistent with our findings.15 Recently, another study conducted in adult patients with asthma also demonstrated that serum EDN levels were significantly higher in those with SA compared to both NSA patients and healthy controls.9 Similarly, in our study, 89 asthma patients with PBEC ≥150 cells/µL were evaluated, and serum EDN levels were found to be significantly elevated in patients with SA compared to those with NSA. Furthermore, this study demonstrated that in the multivariate analysis only serum EDN levels are statistically significant parameters for predicting the SA phenotype (p<0.001). The potential clinical value of EDN in identifying SA should also be considered in comparison with other established biomarkers of eosinophilic inflammation. Compared with conventional markers such as PBEC and ECP, EDN demonstrated stronger diagnostic performance and remained the only independent predictor of the SA phenotype. In recent years, numerous studies have contributed to a better understanding of the pathophysiology of SA, leading to a clearer identification of its characteristic features.16 SA has been shown to occur more frequently in older individuals and in females, and is typically associated with lower baseline pulmonary function, poorer symptom control, and more frequent exacerbations compared to NSA. In our study, although no statistically significant differences were observed between the SA and NSA groups in terms of demographic variables (age, sex, BMI, age at asthma onset, and disease duration), patients with SA exhibited significantly lower pulmonary function parameters, lower ACT scores, and a higher number of exacerbations. Our findings support the hypothesis that serum EDN is a reliable biomarker of type 2 airway inflammation and may serve as a distinguishing feature of the SA phenotype.13 The significantly higher EDN levels observed in the SA group, in parallel with decreased lung function parameters and lower ACT scores, underscore the role of EDN in reflecting the intensity of airway inflammation and epithelial injury.16 These observations are consistent with prior studies that have shown elevated EDN levels in patients with uncontrolled asthma and those with frequent exacerbations.10,12,14
This study investigated the diagnostic and prognostic value of serum EDN levels in patients with SA, demonstrating that elevated EDN levels are significantly associated with disease severity, impaired lung function, poor asthma control, and increased frequency of exacerbations. Our findings support the hypothesis that serum EDN is a reliable biomarker of type 2 airway inflammation and may serve as a distinguishing feature of the SA phenotype. The significantly higher EDN levels observed in the SA group, in parallel with decreased lung function parameters and lower ACT scores, underscore the role of EDN in reflecting the intensity of airway inflammation and epithelial injury. Our results revealed that patients with high EDN levels experienced significantly more asthma exacerbations requiring systemic corticosteroids in the previous year. This finding aligns with existing literature, where elevated EDN has been linked to more frequent and severe exacerbations, likely reflecting heightened eosinophilic activity and persistent airway inflammation.15–17 These findings suggest that EDN may be a useful biomarker not only for disease severity but also for predicting asthma instability and the risk of future exacerbations
Serum EDN levels demonstrated significant positive correlations with both PBEC and serum ECP, two widely recognized markers of eosinophilic inflammation. Moreover, patients with elevated EDN exhibited significantly reduced FEV1, FVC, and FEF25–75 values, as well as lower ACT scores that are indicative of poor disease control and advanced airway obstruction. These associations are in line with studies reporting EDN as a sensitive surrogate marker for pulmonary dysfunction and poor symptom control in eosinophilic asthma.12–14
Serum EDN may also have potential utility in guiding treatment decisions and identifying asthma endotypes. It has been reported that patients with high EDN levels may show differential responses to biologic therapies, particularly anti-IL-5 agents, which target eosinophilic inflammation.18 In this context, EDN could serve not only as a diagnostic biomarker but also as a tool for therapeutic stratification, helping to identify patients who may benefit from targeted biologics.
Limitations
This study has several limitations. First, it was conducted at a single center, which may limit the generalizability of the results. Conducting multicenter studies could help confirm the diagnostic accuracy of serum EDN for SA across different geographic populations. In addition, studies with larger sample sizes could more robustly evaluate the relationship between serum EDN levels, disease severity, and treatment response. Another limitation is the need for long-term prospective studies, particularly when considering patients’ treatment histories and medication use. In the current study, the association between clinical outcomes and serum EDN levels was assessed using cross-sectional data only. Longitudinal follow-up studies could help determine the prognostic value of EDN in the long-term course of asthma. Future research should focus more extensively on the role of serum EDN in asthma management and its impact on treatment response. Furthermore, investigations into the relationship between EDN levels, airway remodeling, and asthma exacerbations could provide deeper insights into the clinical utility of this biomarker.
Conclusion
The findings of this study suggest that serum EDN levels may serve as a valuable biomarker for both the diagnosis and assessment of disease severity in patients with SA. Elevated EDN levels were associated with lower pulmonary function test parameters, poorer asthma control, and increased frequency of exacerbations, supporting the notion that EDN may represent a distinct endotype of SA. Therefore, the use of EDN in guiding personalized asthma treatment, monitoring therapeutic response, and predicting prognosis represents a promising area warranting further investigation.
Mandatory Disclosure on Use of Artificial Intelligence
The authors declare that the artificial intelligence application ChatGPT was utilized to enhance the quality and clarity of the academic English writing. All references have been manually verified for accuracy and relevance.
Author Contributions
All authors contributed equally to this article.
Conflicts of Interest
The authors had no relevant financial interests to disclose.
Funding
None.
REFERENCES
1 Global Initiative for Asthma. 2024 GINA Main Report. Global strategy for asthma management and prevention. Accessed on July 12, 2024. Available from: https://ginasthma.org/2024-report
2 Mortimer K, Lesosky M, García-Marcos L, Innes Asher M, Pearce N, Ellwood E et al. The burden of asthma, hay fever and eczema in adults in 17 countries: GAN phase I study. Eur. Respir. J. 2022;60:2102865. 10.1183/13993003.02865-2021
3 Asher MI, Rutter CE, Bissell K, Chiang CY, El Sony A, Ellwood E et al. Worldwide trends in the burden of asthma symptoms in school-aged children: global asthma network phase I cross-sectional study. Lancet. 2021;398:1569–1580. 10.1016/S0140-6736(21)01450-1
4 Konig IR, Fuchs O, Hansen G, von Mutius E, Kopp MV. What is precision medicine? Eur. Respir. J. 2017;50:1700391. 10.1183/13993003.00391-2017
5 Busse WW, Rosenwasser LJ. Mechanisms of asthma. J. Allergy Clin. Immunol. 2003; 111:S799–S804. 10.1067/mai.2003.158
6 Kim CK, Callaway Z, Pawankar R. Eosinophil granule proteins as a biomarker in managing asthma and allergies. Asia Pac. Allergy. 2023 Jun 13(2):66–71. 10.5415/apallergy.0000000000000104
7 Saitoh O, Kojima K, Sugi K, Matsuse R, Uchida K, Tabata K, et al. Fecal eosinophil granule-derived proteins reflect disease activity in inflammatory bowel disease. Am. J. Gastroenterol. 1999;94:3513–3520. 10.1111/j.1572-0241.1999.01640.x
8 Rutten B, Young S, Rhedin M, Olsson M, Kurian N, Syed F, et al. Eosinophil-derived neurotoxin: a biologically and analytically attractive asthma biomarker. PLoS One. 2021;16:e0246627. 10.1371/journal.pone.0246627
9 Lee Y, Lee JH, Yang EM, Kwon EM, Jung CG, Kim SC, et al. Serum levels of eosinophil-derived neurotoxin: a biomarker for asthma severity in adult asthma. Allergy Asthma Immunol. Res. 2019;11:394–405. 10.4168/aair.2019.11.3.394
10 Agache I, Strasser DS, Klenk A. Agache C, Farine H, Ciobanu C et al. Serum IL-5 and IL-13 consistently serve as the best predictors for the blood eosinophilia phenotype in adult asthmatics. Allergy. 2016;71:1192–1202. 10.1111/all.12906
11 Kim CK. Eosinophil-derived neurotoxin: a novel biomarker for diagnosis and monitoring of asthma. Korean J. Pediatr. 2013;56(1):8–12. 10.3345/kjp.2013.56.1.8
12 Chung KF, Wenzel SE, Brozek JL, Bush A, Castro M, Sterk PJ, et al. International ERS/ATS guidelines on definition, evaluation and treatment of severe asthma. Eur. Respir. J. 2014;43:343–73. 10.1183/09031936.00202013
13 Malinovschi A, Rydell N, Fujisawa T, Borres MP, Kim CK. Clinical potential of eosinophil-derived neurotoxin in asthma management. J. Allergy. Clin. Immunol. Pract. 2023 Mar 11(3):750–761. 10.1016/j.jaip.2022.11.046
14 Färdig M, Lie A, Borres MP, Ekenkrantz T, Granum B, Haugen G, et al. Eosinophil-derived neurotoxin levels in early childhood and association with preschool asthma—a prospective observational study. Clin. Exp. Allergy. 2023 Nov 53(11):1198–1211. 10.1111/cea.14409
15 Kim CK, Callaway Z, Fletcher R, Koh YY. Eosinophil-derived neurotoxin in childhood asthma: correlation with disease severity. J. Asthma. 2010;47:568–73. 10.3109/02770901003792833
16 Hussain M, Liu G. Eosinophilic asthma: pathophysiology and therapeutic horizons. Cells. 2024 Feb 23;13(5):384. 10.3390/cells13050384
17 An J, Lee JH, Sim JH, Song WJ, Kwon HS, Cho YS, et al. Serum eosinophil-derived neurotoxin better reflect asthma control status than blood eosinophil counts. J. Allergy Clin. Immunol. Pract. 2020 Sep 8(8):2681–2688.e1. 10.1016/j.jaip.2020.03.035
18 Jang JH, Woo SD, Lee Y, Kim CK, Shin YS, Ye YM, et al. Changes in type 2 biomarkers after anti-IL5 treatment in patients with severe eosinophilic asthma. Allergy Asthma Immunol. Res. 2021 Mar 13(2):330–338. 10.4168/aair.2021.13.2.330