
Download
ORIGINAL ARTICLE
Changing trends in aeroallergen sensitization: Evidence for gender-specific profiles
Violeta Lokaj-Berisha, Besa Gacaferri Lumezi*
University of Prishtina “Hasan Prishtina”, Faculty of Medicine, Department of Physiology & Immunology, Prishtina, Kosovo
Abstract
Background: Sex-related differences in allergic diseases are recognized; however, variation in aeroallergen sensitization patterns across clinical populations remains incompletely characterized.
Objective: To examine sex-specific differences in sensitization profiles and polysensitization across two independent clinical cohorts.
Methods: Skin prick test (SPT) results and serum total IgE levels from 226 participants were retrospectively analyzed from two cross-sectional cohorts (2005–2006 and 2011–2012) at a tertiary referral center. Sensitization patterns and polysensitization were compared by sex and diagnosis. Multivariable logistic regression models were used to assess independent associations, adjusting for age, diagnosis, and cohort.
Results: In the earlier cohort, females exhibited higher total IgE levels and a greater prevalence of allergic rhinitis, whereas asthma predominated among males. In the later cohort, males demonstrated broader sensitization profiles and higher polysensitization rates. After adjustment for age and diagnosis, sex remained independently associated with polysensitization (aOR 0.41, 95% CI 0.17–0.99, p=0.048), while cohort differences were not statistically significant. House dust mites were the most prevalent allergen in both cohorts.
Conclusions: Sex significantly influences aeroallergen sensitization patterns in clinical populations. The observed cohort differences appear to be largely explained by demographic and diagnostic composition rather than definitive temporal trends.
Key words: aeroallergens, polysensitization, sensitization pattern, skin prick test, sex
*Corresponding author: Besa Gacaferri Lumezi, University of Prishtina “Hasan Prishtina”, Faculty of Medicine, Department of Physiology & Immunology, Prishtina, Kosovo. Email address: [email protected]
Received 24 December 2025; Accepted 4 March 2026; Available online 1 July 2026
Copyright: Lokaj-Berisha V and Gacaferri Lumezi B
This open access article is licensed under Creative Commons Attribution 4.0 International (CC BY 4.0). http://creativecommons.org/licenses/by/4.0/
Introduction
Aeroallergen sensitization is central to the pathogenesis of allergic rhinitis (AR), asthma (A), and other atopic diseases. Sensitization patterns differ by sex, age, and environmental exposure, influencing clinical expression and disease severity.1 Increasing evidence highlights complex interactions between biological sex, environmental factors, and immune responses in polysensitization.
A 2025 comparative study in climate-matched populations from Spain and Peru reported broader sensitization profiles among patients with asthma—predominantly females—with 85% reacting to at least one allergen, particularly mites, suggesting a link between female sex, asthma, and polysensitization severity.2 Although not designated to assess sex differences specifically, the findings indicate possible sex-related immunological variability. Environmental determinants, including pollution and socioeconomic factors, further modulated sensitization patterns across regions. Moreover, studies on polyfluoroalkyl substances (PFAS) suggest that hormonal and immunological mechanisms—particularly those involving the hypothalamic–pituitary–gonadal axis—may contribute to heightened allergic and autoimmune responses in women.3 Supporting this concept, women have been reported to experience more severe nasal symptoms in nasal septum deviation (NSD), indirectly suggesting greater female sensitivity to nasal airway challenges.4
Sex differences in sensitization are age-dependent. In childhood, boys demonstrate higher aeroallergen sensitization rates. A large study in Shanghai involving nearly 40,000 children showed higher sensitization among boys to house dust mites, molds, and pet dander.5 In contrast, adulthood shows a shift toward female predominance. A nationwide study in South Korea (2007–2022) found higher prevalence rates of allergic rhinitis and atopic dermatitis in females.6 A meta-analysis further described a “sex switch” phenomenon in coexisting allergic rhinitis and asthma: male predominance in childhood, female predominance in adolescence, and no significant differences in adulthood. This pattern was consistent globally, except in parts of Asia, where male predominance persisted.7–9
Sensitization patterns also vary across allergic phenotypes. In Thailand, allergic rhinitis patients most frequently reacted to mite mix (86.3%), cockroach mix (55.4%), and grass pollen (39.2%), with polysensitization observed in 68.4%.10 In asthma, aeroallergen sensitization affects 50–95% of patients and correlates with disease severity.11 In one cohort of 798 asthma patients, 62.8% were polysensitized, and 81.8% reacted to six or more allergens.12 Among eczema patients in Vietnam, sensitization to Deramtophagoides pteronyssinus (69.2%), D. farinae (42.9%), and Blomia tropicalis (42.9%) was reported, with 42.9% polysensitized.13 In atopic individuals without overt allergic diseases, sex differences are less pronounced, though males may exhibit higher total IgE levels and sensitization to certain allergens. In an Andean preschool cohort, atopy prevalence was 33.5%, predominantly to mites (23.3%).14
Climate change is expected to exacerbate aeroallergen sensitization, particularly in Europe, due to geographic pollen redistribution and prolonged seasons.15 A multicenter Northern Hemisphere study across 17 locations demonstrated that pollen seasons have lengthened by 0.9 days annually at most sites, with further increases projected due to rising temperatures.16
Collectively, these findings support sex-specific considerations in allergic disease diagnosis and management. Females more frequently exhibit sensitization to indoor allergens (mites, cockroach), whereas males show higher sensitization to pollens and molds,although patterns vary by age and geography. The 2024–2025 ARIA guidelines emphasize exposure, response patterns, and integrated self- and specialist care.17
Methods
Ethics Statement: The original studies conducted in 2005–2006 and 2011–2012 were approved by the Council of the Faculty of Medicine (ref. No. 20956) and the Ethics Committee of the Faculty of Medicine (ref. No. 1551). The present analysis involved secondary use of anonymized data and did not require additional ethical approval. No identifying information was accessible during data processing.
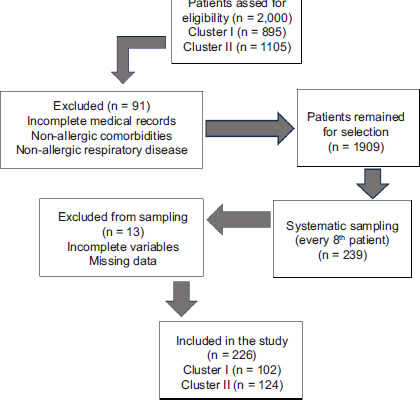
Subjects: Skin prick test results (SPT) from 2005 to 2012 were retrospectively analyzed across two study periods separated by six years: 2005–2006 (Cluster I) and 2011–2012 (Cluster II). A total of 226 participants were randomly selected from approximately 2,000 available medical records using systematic sampling (by selecting every 8th patient) from the medical records database of the tertiary referral center at the Institute of Physiology and Immunology, outpatient Allergy Service, University Clinical Center of Kosovo.
Of the 226 participants, 158 were symptomatic patients and 68 were healthy controls.
Cluster I (2005–2006) included 102 participants: 64 patients with airway allergies (23% asthma, 12.5% combined asthma and rhinitis, and 64% rhinitis only) and 38 controls.
Cluster II (2011–2012) included 124 participants:94 patients (6.45% asthma, 16.3% combined asthma and rhinitis, and 53.2% rhinitis only), and 30 controls.
Inclusion criteria
Medical records were eligible if they included at least one positive skin prick test (SPT) to an aeroallergen, a physician-confirmed diagnosis of IgE-mediated allergies (allergic rhinitis, asthma, or both), documented respiratory symptoms based on ARIA guidelines, discontinuation of antihistamines and systemic corticosteroids for an adequate washout period, completed demographic data, family history of atopy, and serum total IgE measurements.
For Cluster II, additional recorded variables included body mass index (BMI), coffee consumption, smoking status, and physical activity level.
Medical records were reviewed and evaluated for research purposes on January 7, 2025.
Skin prick tests (SPTs) were performed using the same standardized allergen panel for all participants, consisting of aeroallergens supplied by Allergopharma (Reinbeck, Germany). The panel included pollens (grasses, trees, weeds), house dust mites (Dermatophagoides pteronyssinus and Deramtophagoides farine), animal dander (cat, dog, golden hamster, guinea pig), and molds (Alternaria, Cladosporium, Penicillium notatum). Histamine solution (1 mg/mL) served as the positive control, and saline solution as the negative control. A positive SPT reaction was defined as a wheal diameter ≥3 mm greater than the negative control, measured 15 minutes after application using a sterile lancet.
Serum total IgE levels were determined using radioimmunoassay (RIA) (Beckman Coulter Immunotech, France). The reference threshold for elevated IgE was >100 IU/ml in adults and >183 IU/ml in children.
Exclusion criteria
Patients with incomplete medical records non-allergic comorbidities, or non-allergic respiratory disease were excluded. A total of 91 records were excluded from the analysis (Figure 1).
Figure 1 Flow diagram of participant enrollment, allocation, and analysis.
Statistical analysis
Data processing was conducted using the JASP statistical package, version 0.19.3, and graphical representations were created using Microsoft Office Excel 2016. ANOVA was utilized to compare variances among groups, while Bonferroni correction was applied for multiple comparisons. Effect sizes were reported as Cramér’s V for categorical variables. Multivariable logistic regression models were constructed to assess independent predictors of polysensitization. Age, sex, diagnosis, and cohort (Cluster I vs Cluster II) were included as covariates. A secondary model was performed in Cluster II, including BMI, smoking status, coffee intake, and physical activity. Adjusted odds ratios (aOR) with 95% confidence intervals were calculated. Missing data were handled using complete-case analysis. Statistical significance was set at p < 0.05.
Results
The study population consisted of 226 randomly selected participants, divided into two clusters separated by a six-year interval for skin prick test evaluations.
Cluster I Results
Frequencies in the 2005–2006 study group (Cluster I) included 62.75% patients and 37.25% healthy controls. Among patients, 40.20% were diagnosed with allergic rhinitis (AR), 14.71% with asthma (A), and 7.84% with both allergic rhinitis and asthma (AR/A). The gender distribution showed that 52.94% were female and 47.06% male.
A statistically significant association was found between gender and diagnosis (χ2(3) = 10.48, p = 0.015, Cramér’s V = 0.32), with 74.36% of females diagnosed with AR compared to 48% of males. In contrast, 28% and 24% of males were diagnosed with A and AR/A, respectively, compared to 20.5% and 5.1% of females (Table 1).
Table 1 Descriptive statistics: Cluster I study group.
| Gender | Frequencies for Dg. | Dg. | Frequency (%) | Age (Mean) | Age group (years) | Education level (%) | IgE (lU/ml) Mean | Allergic symptoms (%) | P valuee | ||||
|---|---|---|---|---|---|---|---|---|---|---|---|---|---|
| Lower | Middle | Higher | Annual | Seasonal | Annual with seasonal exacerbations | ||||||||
| F | 8 | Aa | 20.513 | 23.25 | 10-19;40-49 | 17.95 | 2.56 | 0 | 391.41 | 37.5 | 37.5 | 25 | |
| 2 | AR/Ab | 5.128 | 47 | 40-59 | 2.56 | 0 | 2.56 | 217.5 | 0 | 0 | 100 | ||
| 29 | ARc | 74.359 | 26.28 | 10-39 | 46.15 | 7.69 | 20.51 | 227.98 | 27.6 | 20.7 | 48.3 | ||
| 15 | Cd | 14.71 | 20.2 | 20-29 | 0 | 0 | 100 | 60.71 | - | - | - | ||
| Μ | 7 | Aa | 28 | 18.57 | 10-19 | 28 | 0 | 0 | 231.29 | 0 | 42.8 | 57.14 | |
| 6 | AR/Ab | 24 | 24 | 0-9 | 16 | 4 | 4 | 195.12 | 33.3 | 0 | 66.7 | ||
| 12 | ARC | 48 | 28.33 | 30-39 | 20 | 8 | 20 | 113.92 | 25 | 16.7 | 58.3 | ||
| 23 | Cd | 22.55 | 20.65 | 20-29 | 0 | 0 | 100 | 63.18 | - | - | - | ||
| Significant differences between variables | |||||||||||||
| Gender | Diagnosis | 0.015e | |||||||||||
| Age | Diagnosis | 0.011e | |||||||||||
| IgE | Gender | 0.007e | |||||||||||
| IgE | Diagnosis | <0.001e | |||||||||||
| IgE 10-19 | IgE 20-29 | <0.001e | |||||||||||
| IgE 10-19 | IgE 30-39 | <0.017 e | |||||||||||
| IgE Controls | IgE Asthma | <0.001e | |||||||||||
| IgE Controls | IgE Allergic Rhinitis | 0.001e | |||||||||||
| IgE Asthma | IgE Allergic Rhinitis | 0.041e | |||||||||||
aAsthma, bAllergic Rhinitis with Asthma, cAllergic Rhinitis, dControl group, eLevel of significance <0.05.
The mean age of participants was 23.8 years (range: 6–55 years), with females averaging 24.91 ± 10.45 years and males 22.69 ± 11.06 years. In the AR group, males were slightly older than females (28.33 vs. 26.28 years), whereas in the A and AR/A groups, females were older than males (23 vs. 18.57 years and 47 vs. 24 years, respectively). A two-factor ANOVA revealed a significant effect of age on diagnosis (p = 0.011), with Bonferroni post-hoc tests identifying significant differences between controls and the AR/A group among females. No significant gender differences in age were observed among healthy controls (females: 20.2 years; males: 20.65 years) (Table 1).
Moreover, according to frequencies by age group, we found that the majority of patients with A belonged to the 10–19 years age group (46.7%). Patients with A/AR were older, belonging to the 40–49 (25%) and 50–59 years (25%) age groups. Patients with AR were distributed across different age groups within the range of 19–39 years, with the majority (31.7%) in the 30–39 years age group (Table 1).
Regarding education levels, 65.6% of respondents reported lower level, 18.7% higher level and 15.6% middle education level (Table 1).
Cluster I - total serum IgE levels
Total serum IgE levels were higher in females (mean: 205.34 ± 189.76 IU/mL) compared to males (mean: 116.87 ± 129.15 IU/mL), with a statistically significant difference between genders (t(93.88) = 2.78, p = 0.007).
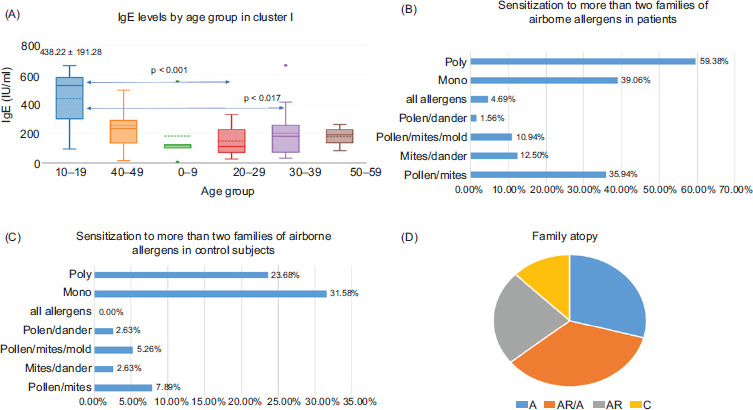
The highest IgE concentrations were observed in the 10–19-year age group (mean: 438.22 ± 191.28 IU/mL), significantly higher than in the 20–29 and 30–39-year groups (Bonferroni post-hoc test, p < 0.001 and p < 0.017, respectively) (Table 1) (Figure 2A).
Figure 2 Serum IgE levels, aeroallergen sensitization patterns, and family history of atopy in Cluster I.
IgE levels varied significantly by diagnosis (F = 12.34, p < 0.001). Patients with asthma (A) had the highest IgE levels (316.69 ± 249.71 IU/mL), followed by those with AR/A (200.71 ± 158.56 IU/mL), AR (194.6 ± 150.78 IU/mL), and healthy controls (62.2 ± 61.6 IU/mL). Bonferroni post-hoc analysis revealed significant differences between: Controls and A (p < 0.001), Controls and AR (p = 0.001), and A and AR (p = 0.041) (Table 1) (Figure 2A).
Cluster I - Allergic symptoms and skin prick test (SPT) results
The frequency of allergic symptoms varied by diagnosis. Among patients with asthma, 40% reported seasonal symptoms, 20% reported year-round symptoms, and 40% experienced both with seasonal exacerbations (Table 1).
Patients with allergic rhinitis (AR) most commonly reported year-round symptoms with seasonal exacerbations (51.2%), followed by annual symptoms (26.8%). Seasonal occurred in 19.5% of AR patients.
Among patients with both AR and asthma (AR/A), 75% reported annual symptoms with seasonal exacerbations, and 25% reported annual symptoms (Table 1).
SPT results showed that 85.16% of patients were sensitized to house dust mites. Sensitization to grass pollen was observed in 41.7% of patients (Figure 2A). In comparison, control participants showed sensitization rates of 31.6% to dust mites and 18.4% to tree pollen (Figure 2D).
Sensitization to tree and weed pollens occurred in 17.97% and 18.75% of patients, respectively. Animal dander sensitization was observed in 8.2%, while molds accounted for 4.3% (Figure 2A).
Patients with AR demonstrated higher sensitization rates to all pollen types (grass, weeds, and trees) compared to those with A or AR/A. They also showed increased reactivity to dog dander (12.2%), Cladosporium (7.3%), and Aspergillus (7.3%). Although AR patients had high sensitization to dust mites (D. farinae 82.9%, D. pteronyssinus 85.4%), asthma patients showed even higher rates (93.3%). Asthma patients also exhibited sensitization to golden hamster (13.3%), cat dander (13.3%), guinea pig (13.3%), and Penicillium notatum (6.7%) (Figure 2B).
Gender differences in sensitization patterns were evident. Females showed higher sensitivity to grass pollens: 48.7% for grasses, 45.25% for grasses/cereals, and 38.5% for rye. They also showed increased reactivity to alder (17.9%), hazel (20.5%), and E. plantain (20.5%). Furthermore, they had higher sensitization to golden hamster (10.25%), cat (12.8%), and guinea pig dander (7.7%), as well as to all mold aeroallergens (shown in Figure 2C).
While ANOVA yielded a significant overall difference between genders (p < 0.001), Bonferroni post-hoc tests did not identify any pairwise statistical significance (p = 0.91).
In control participants with positive SPT results, males showed higher sensitivity to grass pollen, golden hamster and cat dander, and Penicillium notatum. Conversely, females showed greater sensitivity to tree pollen, mites, dog and guinea pig dander, and Cladosporium (Figure 2D).
Cluster I - Polysensitization and family history of atopy
Polysensitization—defined as sensitization to aeroallergens from two or more different families—was observed in 59.4% of patients, compared to only 23.68% of healthy controls. The most common combination was pollen and mites (35.9%), followed by mites with dander (12.5%), pollen with mites and molds (10.9%), and pollen with dander (1.56%). Sensitization to all allergen categories occurred in 4.7% of patients (Figure 2B).
Among healthy controls, polysensitization was also noted, albeit at lower rates. Co-sensitization to pollen and mites was observed in 7.9%, followed by pollen and molds (5.3%), pollen and dander (2.6%), and combinations including mites, dander, and molds (2.6%) (Figure 2C).
A family history of atopy was reported by 53% of participants. This was highest in patients with AR/A (87.5%) and asthma (73.3%), followed by those with AR (58.5%). Among healthy controls, 32% reported a family history of atopy. Female participants reported a higher rate of atopic family history (32%) compared to males (21.5%) (Figure 2D).
Cluster II results
In the Cluster II study group (2011–2012), 75.8% were patients and 24.2% were healthy controls. Among patients, 53.2% were diagnosed with AR, 6.45% with A, and 16.13% with AR/A. The female-to-male ratio was 1.29 :1, with women comprising 56.4% of participants.
Men showed higher rates of allergic respiratory disease: 62.96% were diagnosed with AR, 18.52% with AR/A, and 7.41% with A (Table 2).
Table 2 Descriptive statistics: Cluster II study group.
| Gender | Frequencies | Dg. | Frequency (%) | Age (Mean) | Age group (years) | Education level (%) | IgE lU/ml Mean | Allergic symptoms (%) | Coffee/ day Number (Mean) | Smoking | Hobby | P* | |||||
|---|---|---|---|---|---|---|---|---|---|---|---|---|---|---|---|---|---|
| Lower | Middle | Higher | Annual | Seasonal | seasonal exacerbations | Active | Passive | ||||||||||
| F | 4 | Aa | 4.9 | 44 | 50-59 | 50 | 0 | 50 | 78.4 | 25 | 50 | 25 | 3.3 | 0 | 25 | sport | |
| 10 | AR/Ab | 12.2 | 30.9 | 20-29 | 40 | 20 | 40 | 195.9 | 30 | 10 | 60 | 3.1 | 20 | 30 | sport | ||
| 32 | ARC | 39 | 30 | 20-39 | 28.1 | 28.1 | 43.7 | 139.8 | 34.4 | 31.2 | 34.4 | 2.1 | 25 | 0 | sport, reading | ||
| 24 | Cd | 29.3 | 32.1 | 20-49 | 16.7 | 12.5 | 70.8 | 50.5 | - | - | - | 2.4 | 20.8 | 0 | sport, reading | ||
| M | 4 | A | 7 | 14.7 | 10-19 | 50 | 50 | 0 | 255 | - | 25 | 50 | - | 0 | 0 | sport | |
| 10 | AR/Ab | 17.5 | 28.2 | 10-19; | 40 | 10 | 50 | 218.9 | 20 | 30 | 50 | 2.5 | 20 | 10 | sport | ||
| 30-39 | |||||||||||||||||
| 34 | ARC | 59.7 | 26.1 | 10-29 | 14.7 | 26.5 | 58.8 | 135.8 | 20.6 | 41.2 | 38.2 | 2.6 | 20.6 | 0 | sport | ||
| 6 | Cd | 10.5 | 33.5 | 20-39; | 0 | 0 | 100 | 26.4 | - | - | - | 1.8 | 0 | 0 | sport; | ||
| 50-59 | reading | ||||||||||||||||
| Significant differences between variables | |||||||||||||||||
| Male | Female | 0.002e | |||||||||||||||
| Age | Coffee | 0.03e | |||||||||||||||
| IgE | Diagnosis | <0.001e | |||||||||||||||
| Allergic Rhinitis/Asthma | Controls | <0.001e | |||||||||||||||
| Allergic Rhinitis | Controls | <0.001e | |||||||||||||||
aAsthma, bAllergic Rhinitis with Asthma, cAllergic Rhinitis, dControl group, eLevel of significance <0.05.
The mean age of participants was 30.5 years (range: 11–59 years), with females being significantly older than males (33.1 ± 11.37 vs. 26.9 ± 11.9 years, p = 0.002) (Table 2). Age-group distribution of diagnoses was consistent with Cluster I. Asthma was most common in male adolescents (50% of A patients were aged 10–19 years), while AR/A patients were younger compared to those in Cluster I (30% were aged 10–19 years). AR was distributed across a wide age range, with the highest frequency in the 20–29 age group (Table 2).
Educational background showed that 51% had higher education, 22.3% had completed secondary education, and 26.6% had a lower level of education (Table 2).
Lifestyle habits were also assessed. More women consumed 2–3 cups of coffee daily, ranging between 1–5 cups (28% consumed 2 cups; 18.3% consumed 3 cups). Among females, 23.2% were active smokers, and only 14.6% engaged in regular physical activity. In contrast, 61.4% of males reported practicing sports, 19.3% drank 2 cups of coffee per day, and 15.8% were active smokers. No significant association was found between gender and smoking (χ2(1) = 0.3). However, coffee consumption positively correlated with age (Pearson’s r = 0.215, p = 0.03) (Table 2).
Cluster II – Total IgE and Sensitization
In contrast to Cluster I, total serum IgE levels were higher in males (155 ± 124.31 IU/mL) than in females (106.79 ± 116.42 IU/mL). ANOVA revealed significant differences in IgE concentrations among diagnostic groups (F = 7.68, p < 0.001). The highest mean IgE levels were found in AR/A patients (207.4 ± 133.73 IU/mL), significantly higher than in controls (45.7 ± 54.26 IU/mL), with p < 0.001 for both AR and AR/A compared to controls (Table 2).
A negative correlation was observed between age and IgE levels (r = −0.231, p = 0.006), indicating younger participants had higher IgE concentrations.
Cluster II – Allergic Symptoms and SPT
Allergic symptoms were reported as annual in 30% of participants, seasonal in 26%, and year-round with seasonal exacerbations in 18.5% (Table 2).
Among patients with AR and A, 37.5% and 36.4%, respectively, reported seasonal exacerbations. Seasonal symptoms alone were reported by 12.5% of A and 27.3% of AR patients. Over half (55%) of AR/A patients reported year-round symptoms with seasonal worsening (Table 2).
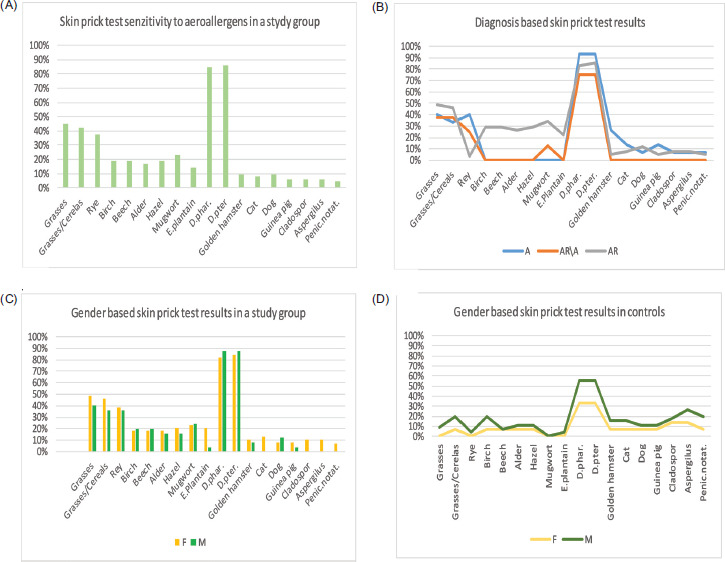
SPT analysis showed that the most common sensitization was to house dust mites (58.2%), followed by grass pollen (38.1%), weed pollen (20.9%), and tree pollen (17.3%). Sensitization to animal dander and molds was less frequent (5.8% and 4.3%, respectively) (Figure 3A).
Figure 3 Comparison of aeroallergen sensitization between patients and control subjects in Cluster I.
Similar to Cluster I, asthma patients showed higher sensitization to grass pollens and mites, with no notable reactivity to animal dander or molds. AR/A patients exhibited the broadest sensitization pattern, including mites, grasses, tree pollens (birch, hazel), weeds, animal dander, and molds (Figure 3B).
Polysensitization and Family History of Atopy
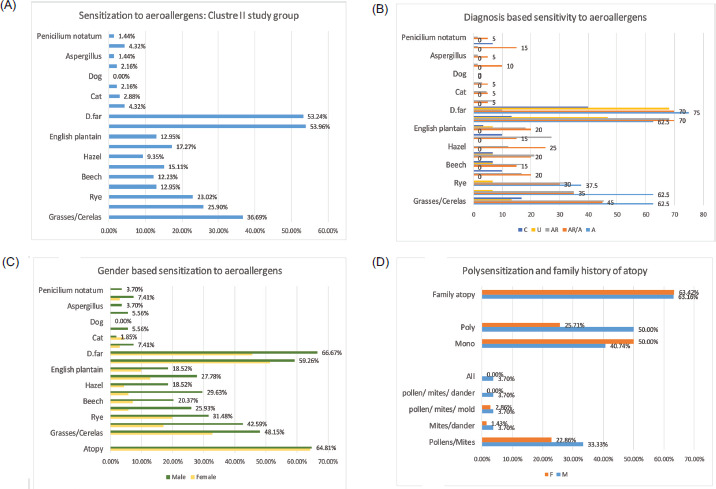
Males exhibited higher sensitization rates to all aeroallergens compared to females (Figure 3C). Polysensitization was present in 36.3% of participants—more common in males (50%) than females (25.7%). The most common co-sensitization was pollen and mites (27.42%), followed by combinations involving pollen, mites, and molds (3.23%), mites and dander (2.42%), and pollen, mites, and dander, or all allergens (each 1.61%) (Figure 3D).
Family history of atopy was higher than in Cluster I (63.3% vs. 53%). The highest atopy rate was again found in AR/A patients (95%), followed by AR (69.7%), U (53.3%), and A (37.5%). In healthy controls, 40% reported an atopic family history.
Figure 4 Aeroallergen sensitization and family history of atopy in Cluster II patients and control subjects.
Multivariable analysis
In multivariable logistic regression including age, sex, diagnosis, and cohort, sex remained independently associated with polysensitization (aOR 0.41, 95% CI 0.17–0.99, p = 0.048), indicating lower odds among males compared to females. Age was not independently associated with polysensitization (p = 0.701). The diagnostic category AR/A remained associated with higher odds compared to controls (p = 0.041). In Cluster II, additional adjustment for BMI, smoking status, coffee intake, and physical activity did not materially alter the association between sex and polysensitization (Table 3).
Table 3 Multivariable Logistic Regression Analysis of Polysensitization (Whole Cohort and Cluster II only.
| Variable | aORa | 95% CIb | P-value |
|---|---|---|---|
| Whole Cohort | |||
| Male vs Female | 0.41 | 0.17–0.99 | 0.048c |
| Age (per year) | 1.00 | 0.97–1.04 | 0.825 |
| AR vs Controls | 2.14 | 0.89–5.15 | 0.087 |
| Asthma vsControls | 2.36 | 0.85–6.54 | 0.098 |
| AR/A vs Controls | 3.12 | 1.05–9.27 | 0.041c |
| Cluster I vs Cluster II | 0.88 | 0.46–1.67 | 0.701 |
| Cluster II only | |||
| Male vs Female | 1.92 | 1.01–3.64 | 0.046c |
| Age | 0.98 | 0.95–1.01 | 0.138 |
| AR/A vs controls | 2.89 | 1.11–7.52 | 0.029c |
| BMI | 1.03 | 0.92–1.16 | 0.583 |
| Smoking | 1.18 | 0.55–2.52 | 0.662 |
| Coffee | 1.07 | 0.84–1.36 | 0.572 |
| Physical activity | 0.91 | 0.51–1.61 | 0.743 |
aadjusted odds ratio, bconfidence interval, cLevel of significance <0.05.
Discussion
This study examined sex-specific differences in aeroallergen sensitization across two independent clinical cohorts separated by six years. The findings demonstrate that sex is an important determinant of sensitization profiles and polysensitization, independent of age and diagnostic composition. In the earlier cohort, females exhibited higher total IgE levels and a greater prevalence of allergic rhinitis, whereas asthma and combined AR/A were more frequent among males. In contrast, in the later cohort, males demonstrated broader sensitization profiles and higher polysensitization rates. However, after multivariable adjustment, cohort differences were attenuated, suggesting that demographic composition and diagnostic heterogeneity partly explain differences between periods.
The consistent association between sex and sensitization patterns aligns with existing literature demonstrating sex-related immunological variations across the lifespan.6–9 Hormonal modulation of immune responses and genetic predisposition may contribute to differential IgE production and allergen reactivity.5,14
House dust mites remained the dominant sensitizing allergen in both cohorts, consistent with regional exposure patterns.10–13 In Cluster I, females showed higher sensitivity to pollens, animal dander, and molds, while in Cluster II, males were more frequently polysensitized across allergen families. These shifting patterns suggest that gender-related sensitization is not static but may be modulated by environmental exposures and demographic transitions.16 The high rates of mite sensitization in asthma patients reaffirm the role of indoor allergens in airway disease severity.18–25
A notable finding of our study is the overall decrease in sensitization to most aeroallergens in Cluster II (2011–2012) compared with Cluster I (2005–2006). The most pronounced decline was observed for house dust mites (−31.6%), followed by animal dander (−29.3%) and, to a lesser extent, grass and tree pollens (−8.6% and −3.7%, respectively). Sensitization to molds remained unchanged, while weed pollen sensitization slightly increased (+11.5%). The observed variation in pollen and animal dander sensitization across cohorts may reflect referral patterns, diagnostic distribution, and age structure, rather than definitive population-level temporal changes.16,23,24
Polysensitization was frequent in both clusters but showed gender divergence: it was more prevalent among females in Cluster I and among males in Cluster II. This could reflect cohort effects or changing environmental influences.1,25 Family history of atopy was consistently high, particularly in AR/asthma patients, underscoring genetic predisposition.25 The observed increase from 53% (Cluster I) to 63% (Cluster II) aligns with global trends of rising atopy prevalence, potentially linked to urbanization and environmental change.26
In Cluster II, lifestyle data suggested possible modifying effects. Coffee consumption was higher among women and correlated with age, whereas men reported greater physical activity. Lifestyle variables assessed in Cluster II did not independently predict polysensitization after adjustment. This suggests that biological sex and diagnostic phenotype exert a stronger influence on sensitization profiles than the lifestyle indicators evaluated.
Beyond biological sex, environmental factors may contribute to the observed differences between clusters. Climate change, with prolonged pollen seasons and altered allergen distribution, may exacerbate gender disparities in sensitization.15 Additionally, urban air pollution and household exposures could explain persistently high mite sensitization rates in our population, as reported in comparable European and Asian cohorts.
However, differences observed between cohorts should be interpreted cautiously. Because the study design consists of two independent cross-sectional samples rather than a longitudinal follow-up, variations between cohorts may reflect differences in demographic composition, diagnostic distribution, and referral patterns rather than clear population-level temporal shifts. Environmental explanations, including housing conditions, urbanization, or climate-related changes in pollen exposure, were not directly measured and therefore remain speculative. Adjustment analyses indicated that sex and diagnostic composition contributed substantially to the observed differences in polysensitization patterns.
Strengths and Limitations
The principal strength of this study lies in the application of standardized skin prick testing (SPT) protocols and the use of uniform allergen extracts, ensuring methodological consistency and intergroup comparability. Test outcomes were systematically correlated with patients’ clinical manifestations to minimize false-positive sensitization results. Moreover, all participants were verified to have discontinued antihistamines and systemic corticosteroids for an adequate washout period prior to testing, thereby reducing pharmacological interference. The inclusion of a healthy control group strengthened the analytical framework by enabling reliable gender-based comparisons. In addition, random allocation of participants mitigated the risk of demographic imbalance and reduced the likelihood of overrepresentation of specific disease phenotypes, thereby enhancing the internal validity of the study; however, this study has several limitations. First, its retrospective cross-sectional design limits causal conclusions. Second, participants were recruited from a tertiary referral center, which may overrepresent more severe allergic phenotypes and restrict generalizability. Third, lifestyle variables were only available for the second group, limiting the ability to perform direct temporal comparisons. Finally, molecular profiling of allergens was not performed.
Conclusion
Sex significantly influences aeroallergen sensitization patterns and polysensitization in clinical populations. Differences observed between cohorts appear largely attributable to demographic and diagnostic composition rather than definitive temporal trends. These findings emphasize the importance of incorporating sex-specific considerations into allergy evaluation and management strategies.
Mandatory Disclosure on Use of Artificial Intelligence
The authors used ChatGPT (Free version) for language editing and clarity improvement. All content was reviewed and verified by the authors. All references have been manually verified for accuracy and relevance.
Author Contributions
VLB: made a substantial contribution to the conception of the study, acquisition of data, analysis and interpretation of data and drafted the manuscript. BGL: drafted the article and revised it critically for important intellectual content. VLB and BGL approved the final version to be submitted.
Conflict of Interest
The authors declare no potential conflicts of interest with respect to research, authorship and/or publication of this article.
Funding
The authors have no funding sources to declare.
REFERENCES
1 Beutner C, Forkel S, Gupta S, Fuchs T, Schön MP, Geier J, et al. Sex-and Age-Dependent Changes in Polysensitization to Common Aeroallergens Over 20 Years. J Asthma Allergy. 2020 Dec;24(13):725-30. 10.2147/JAA.S280771
2 González-Pérez R, Galván-Calle CA, Galán T, Poza-Guedes P, Sánchez-Machín I, Enrique-Calderón OM, et al. Molecular Signatures of Aeroallergen Sensitization in Respiratory Allergy: A Comparative Study Across Climate-Matched Populations. Int J Mol Sci. 2024 Dec;26(1):284. 10.3390/ijms26010284
3 Ajana R, Rachoń D, Gałęzowska G. Reproductive toxicity of per- and polyfluoroalkyl substances. Environ Toxicol Pharmacol. 2025 Aug;117:104740. 10.1016/j.etap.2025.104740
4 Nadaf AA, Pranavi C, Abhinaya D, Dholi SK. Retrospective cohort study: a gender-based analysis of symptom severity and age correlation in nasal septum deviation. World J Biol Pharm Health Sci. 2025 Jan;21(1):422–26. 10.30574/wjbphs.2025.21.1.1035
5 Ying X, Qi X, Yin Y, Wang H, Zhang H, Jiang H, et al. Allergen sensitization among children with allergic diseases in Shanghai, China: age and sex differences. Respir Res. 2022 Apr;23(1):95. 10.1186/s12931-022-02008-7
6 Yim Y, Jo H, Park S, et al. Sex-specific and long-term trends of asthma, allergic rhinitis, and atopic dermatitis in South Korea, 2007–2022: a nationwide representative study. Int Arch Allergy Immunol. 2025 Sep;186(2):166–83. 10.1159/000540928
7 Pinart M, Keller T, Reich A, Fröhlich M, Cabieses B, Hohmann C, et al. Sex-related allergic rhinitis prevalence switch from childhood to adulthood: a systematic review and meta-analysis. Int Arch Allergy Immunol. 2017 Apr;172(4):224–35. 10.1159/000464324
8 Fröhlich M, Pinart M, Keller T, Reich A, Cabieses B, Hohmann C, et al. Is there a sex shift in prevalence of allergic rhinitis and comorbid asthma from childhood to adulthood? A meta-analysis. Clin Transl Allergy. 2017 Dec;7:44. 10.1186/s13601-017-0176-5
9 Dai L, Liu J, Zhao Q, Li M, Zhou Y, Chen Z, et al. Investigation of allergic sensitizations in children with allergic rhinitis and/or asthma. Front Pediatr. 2022 Mar;10:84229. 10.3389/fped.2022.842293
10 Pothirat C, Chaiwong W. Aeroallergen sensitization and clinical characteristics of subjects with chronic rhinitis in Chiang Mai, Thailand: a twenty-year retrospective study. J Asthma Allergy. 2021 Jul;14:789–95. 10.2147/JAA.S315081
11 Craig TJ. Aeroallergen sensitization in asthma: prevalence and correlation with severity. Allergy Asthma Proc. 2010 Mar–Apr;31(2):96–102. 10.2500/aap.2010.31.3310
12 Kothandarama K, Mohindra S, Arungovind K, Mahendru S. Prevalence of common aeroallergens in allergic rhinitis and its correlation with bronchial asthma: a study on 798 patients by skin prick test. Indian J Otolaryngol Head Neck Surg. 2023 Sep;75(3):1651–59. 10.1007/s12070-023-03643-2
13 Trinh TH, Nguyen PT, Tran TT, Pawankar R, Pham DL. Profile of aeroallergen sensitizations in allergic patients living in southern Vietnam. Front Allergy. 2023 Jan;3:1058865. 10.3389/falgy.2022.1058865
14 Ochoa-Avilés C, Morillo D, Rodriguez A, Cooper PJ, Andrade S, Molina M, et al. Prevalence and risk factors for asthma, rhinitis, eczema, and atopy among preschool children in an Andean city. PLoS One. 2020;15(7):e0236843. 10.1371/journal.pone.0236843
15 Lake IR, Jones NR, Agnew M, Goodess CM, Giorgi F, Hamaoui-Laguel L, et al. Climate change and future pollen allergy in Europe. Environ Health Perspect. 2016 Aug;125(3):385–91. 10.1289/EHP173
16 Ziska LH, Makra L, Harry SK, Bruffaerts N, Hendrickx M, Coates F, Saarto A, et al. Temperature-related changes in airborne allergenic pollen abundance and seasonality across the northern hemisphere: a retrospective data analysis. Lancet Planet Health. 2019 Mar;3(3):e124–e131. 10.1016/S2542-5196(19)30015-4
17 Bousquet J, Sousa-Pinto B, Vieira RJ, Schünemann HJ, Zuberbier T, Bognanni A, et al. Methodology for the development of the allergic rhinitis and its impact on asthma (ARIA)-EAACI 2024-2025 Guidelines: From evidence-to-decision frameworks to digitalised shared decision-making algorithms. Allergy. 2026 Feb;81(2):427–453. 10.1111/all.70100. Epub 2025 Nov 21. PMid: 41268627; PMCID: PMC12862529.
18 Chan-Yeung M, Manfreda J, Dimich-Ward H, Lam J, Ferguson A, Warren P, et al. Mite and cat allergen levels in homes and severity of asthma. Am J Respir Crit Care Med. 1995 Dec;152(6 Pt 1):1805–11. 10.1164/ajrccm.152.6.8520740
19 Custovic A, Taggart SC, Francis HC, Chapman MD, Woodcock A. Exposure to house dust mite allergens and the clinical activity of asthma. J Allergy Clin Immunol. 1996 Jul;98(1):64–72. 10.1016/S0091-6749(96)70227-0
20 van der Heide S, De Monchy JG, De Vries K, Dubois AE, Kauffman HF. Seasonal differences in airway hyperresponsiveness in asthmatic patients: relationship with allergen exposure and sensitization to house dust mites. Clin Exp Allergy. 1997 Jun;27(6):627–33. 10.1111/j.1365-2222.1997.tb01189.x
21 Tizek L, Redlinger E, Ring J, Eyerich K, Biedermann T, Zink A. Urban vs rural: prevalence of self-reported allergies in various occupational and regional settings. World Allergy Organ J. 2022 Jan;15(1):100625. 10.1016/j.waojou.2022.100625
22 Mehulić M, Mehulić K, Vuljanko IM, Kukulj S, Grle SP, Vukić AD, et al. Changing pattern of sensitization in Croatia to aeroallergens in adult population referring to an allergy clinic during a period of 15 years. Coll Antropol. 2011 Jun;35(2):529–36.
23 Lou H, Ma S, Zhao Y, Cao F, He F, Liu Z, et al. Sensitization patterns and minimum screening panels for aeroallergens in self-reported allergic rhinitis in China. Sci Rep. 2017 Aug;7:9286. 10.1038/s41598-017-10111-9
24 Zhao Z, Chen L, Huang, C, Huang Zh, Liu X, Hu B, et al. Allergen sensitization patterns in children with allergic rhinitis: insights from a four-year retrospective study in Shenzhen, China. BMC Pediatr. 2025;25: 544. 10.1186/s12887-025-05885-1
25 Mkilima T. Urban aerosols, the microbiome, and the rise of “urban atopy”. Aerosol Sci Eng. 2025 Jun. 10.1007/s41810-025-00331-2
26 Nieman DC, Wentz LM. The compelling link between physical activity and the body’s defense system. J Sport Health Sci. 2019 May;8(3):201–17. 10.1016/j.jshs.2018.09.009