
Download
ORIGINAL ARTICLE
Clinical and serological characteristics of patients allergic to LTP
Juan Carlos Miralles-Lopeza*, Antonio Carbonell-Martíneza, Soledad Zamarro-Parraa, Cristina Navarro-Garridoa, Ana Isabel Escudero-Pastora, Muna Boulaicha, Sol Sanromán-Sirventa, Yulia Petryk-Petryka, Maria Dolores Ladrón-de-Guevaraa, Virginia Pérez-Fernándezb
aAllergy Section, University General Hospital Reina Sofía, Murcia, Spain
bDepartment of Public Health Sciences, University of Murcia School of Medicine, Murcia, Spain
Abstract
Background: Allergy to lipid transfer proteins (LPT) is common in Mediterranean Europe, and it causes severe reactions in patients and affects multiple foods, impairing the quality of life.
Objective: This study aimed to describe the clinical and sensitization profile of patients with LTP syndrome and to determine a clinical pattern of severity. Molecular diagnosis is shown in a broad population through microarrays.
Material and Methods: This study was performed at the LTP Allergy Consultation of the Reina Sofia Hospital in Murcia, Spain. We analyzed the patients’ characteristics, reactions, cofactors, food implicated, quality of life, skin prick test to food and aeroallergens, and serologic parameters, such as total immunoglobulin E, peach LTP (Pru p 3 IgE) and immunoglobulin G4, and microarray Immuno Solid-phase Allergen Chip (ISAC). We related the severity of the reactions with other variables.
Results: We presented a series of 236 patients diagnosed with LTP allergy, 54.66% suffering from anaphylaxis, 36.02% from urticaria angioedema, and 9.32% from oral allergy syndrome. The most frequently implicated food was peach, producing symptoms in 70% of patients, followed by walnut in 55%, peanut in 45%, hazelnut in 44%, and apple in 38% patients. Regarding the food that provoked anaphylaxis, walnut was the most frequent instigator, along with peach, peanut, hazelnut, almond, sunflower seed, and apple. According to the severity of LPT reaction, we did not discover significant differences in gender, age, food group involved, and serologic parameters. We found differences in the presence of cofactors, with 48.84% of cofactors in patients with anaphylaxis, compared to 27.1% in patients without anaphylaxis and in family allergy background (P < 0.0001).
Conclusion: In our series of patients, 54% presented anaphylaxis, and the foods that most frequently produced symptoms were peaches, apples, and nuts. Cofactors and family allergy backgrounds were associated with the severity of LPT reaction.
Key words: Food allergy, LTP allergy, Clinical features, Skin prick test, Specific IgE
*Corresponding author: Juan Carlos Miralles-López, Allergy Section, University General Hospital Reina Sofía, Avda. Intendente Jorge Palacios 1, 30003 Murcia, Spain. Email address: [email protected]
Received 8 January 2024; Accepted 6 March 2024; Available online 1 July 2024
Copyright: Miralles-Lopez JC, et al.
License: This open access article is licensed under Creative Commons Attribution 4.0 International (CC BY 4.0). http://creativecommons.org/licenses/by/4.0/
Introduction
Nonspecific lipid transfer proteins (nsLTP) are small (9 kDa) pan-allergens ubiquitous found in the plant kingdom. Patients with food allergy because of peach LTP (Pru p3) constitute a heterogeneous group regarding sensitization profile and severity.1
Allergy to Pru p3 is more common in Mediterranean countries, and these patients often present cross-reactions after ingesting fruits, nuts, cereals, vegetables, and other foods.2,3 The resistance to pepsin and chemical digestion favors the production of anaphylactic reactions.4
Life-threatening reactions happen in patients with LTP syndrome, and in recent years food allergy has been an increasing global concern. Cofactors have been described, and the clinical expression of LTP hypersensitivity often requires one or more cofactors.5 The symptoms of LTP syndrome range from mild reactions, such as urticaria and oral allergy syndrome, to anaphylaxis.
This population has an important impairment in the quality of life, and the Food Allergy Quality of Life Questionnaire (FAQLQ) is a tool to measure it.6,7
The prevalence of allergy to plant foods has been increasing in recent years in Mediterranean regions, and so has sensitization to LTP, as demonstrated in a series of 800 Italian pediatric patients, in which all nsLTPs examined increased between 2010 and 2020.8
An expert consensus-based document published recently provided indications for LTP sensitization management.9 Strategies involve avoidance of the responsible food, self-injectable adrenaline, considered cofactors, and peeling fruits, and verification through in vivo and in vitro testing.
This study aimed to describe the clinical and sensitization profile of patients with LTP syndrome and to determine a clinical pattern of severity. Molecular diagnosis is shown in a broad population through microarrays.
Materials and Methods
This observational, retrospective study was performed at the Reina Sofia Hospital in Murcia, Spain. We included the patients who attended the LTP Allergy Consultation of the Allergy Section from 2014 to 2022. The patients were referred from the allergy clinic in our area (around 200,000 inhabitants) and some patients from nearby health areas.
The study was conducted ethically by following the World Medical Association Declaration of Helsinki and was approved by the Hospital’s Research Ethics Committee. All patients provided informed consent.
We analyzed patient characteristics (gender, age, and family allergy background), reaction characteristics, cofactors, food implicated, quality of life, skin prick test to food, and aeroallergens. Implicated foods were collected through spontaneous and directed anamnesis with a questionnaire that included a broad list of foods that contained LTP and specifically asking about food intake, tolerance, and possible reactions.
Sera were analyzed for immunoglobulin E (IgE) antibodies to LTP peach Pru p3 (ImmunoCAP), total IgE, immunoglobulin G (IgG) 4 to Pru p3, and microarray Immuno Solid-phase Allergen Chip (ISAC; Thermo Fisher, Uppsala, Sweden). The cut off value for positivity of ImmunoCAP was 0.1 KU/L, and for ImmunoCAP ISAC assay, it was 0.3 ISU. We also related the clinical pattern of reactions with other variables.
Quality of life was measured with FAQLQ. The patients or their caregivers completed the questionnaire before attending medical consultation.
Skin prick tests with aeroallergens and foods were performed with commercial extracts (LETI Pharma, Barcelona, Spain) (a fixed battery of the following food extracts was used: hazelnut, peanut, almond, sunflower seed, pistachio, walnut, peach, apple, pear, kiwi, banana, melon, strawberry, pineapple, tomato, celery, paprika, wheat, corn, and profilin). An LTP extract was also used (peach extract enriched with Pru p 3; ALK-Abello, Madrid, Spain). If the patient presented symptoms after eating some food and the skin test with the commercial extract was negative, or the food was not included in the commercial battery, a prick-to-prick test was performed with the implicated fresh food.
We considered patients allergic to LTP as those who presented reactions after ingesting LTP-containing foods and had a positive skin prick test to LTP and/or a positive specific IgE to LTP peach Pru p 3.
An initial descriptive analysis of the study variables was done; absolute frequencies and percentage values were used for qualitative variables and mean and standard deviation of quantitative variables.
The Chi-square test was applied to study association between qualitative variables. The normality of the quantitative variables was studied with the Shapiro–Wilks Test and Student’s t-test was used to compare quantitative variables with clinical parameters. Data analysis was conducted with Stata Program v15 (College Station, TX, USA). For all comparisons, P < 0.05 was considered significant.
Results
We presented a series of 236 patients diagnosed with LTP-allergic reactions to food from 2014 to 2022, and treated at the LTP Allergy Consultation of the Allergy Section of the University Hospital Reina Sofia, Murcia, Spain.
Of all the patients, 169 (71.61%) were females, with an age range of 6–66 years (mean age: 34.72 years); 90% had a family background of allergy. Regarding symptoms of pollen allergy, 115 patients (48.73%) reported symptoms of seasonal allergic rhinitis, 67 (28.39%) had seasonal rhinitis and asthma, and 15 (6.36%) reported as having seasonal asthma (Table 1).
Table 1 Baseline characteristics and severity of anaphylactic reaction.
| No. of patients, 236 | Total | Patients with anaphylaxis 129 (54.66%) | Patients with no anaphylaxis 107 (45.34%) |
|---|---|---|---|
| Females | 169 (71.31%) | 91 | 78 |
| Age (years) | 34.72 (13.18) | 35.27 (12.53) | 34.06 (13.95) |
| Family allergy background | 212 (89.83%) | 124 (96.12%)* | 88 (82.24%) |
| Cofactors | 92 (38.98%) | 63 (48.84%)* | 29 (27.1%) |
| Allergic rhinitis | 115 (48.73%) | 53 (41.08%) | 62 (57.94%) |
| Rhinitis+asthma | 67 (28.39%) | 40 (31.01%) | 27 (24.77%) |
| Asthma | 15 (6.36%) | 9 (6.98%) | 6 (5.61%) |
| FAQLQ | 4.43 (1.25) | 4.45 (1.2) | 4.39 (1.33) |
| Total IgE | 306.83 (463.68) | 255.69 (317.60) | 377.85 (606.33) |
| IgE Pru p 3 | 11.68 (17.23) | 11.28 (17.48) | 12.21 (16.98) |
| IgG4 Pru p 3 | 0.81 (1.30) | 0.84 (1.34) | 0.78 (1.25) |
Data are presented as N (%) or mean (SD). *P < 0.0001. FAQLQ: Food Allergy Quality of Life Questionnaire.
Regarding symptoms presented with food ingestion, 129 patients (54.66%) reported anaphylaxis, 85 (36.02%) reported urticaria-angioedema, and 22 patients (9.32%) reported oral allergy syndrome.
A total of 92 patients (38.98%) reported the presence of cofactors along with allergic reaction: 36 patients (15.25%) reported intake of non-steroidal anti-inflammatory drug (NSAID), 28 (11.86%) reported physical exercise, 6 (2.54%) reported alcohol intake, 20 (8.47%) reported NSAID intake with physical exercise, and 2 patients (0.85%) reported physical exercise with alcohol intake. The mean score of FAQLQ questionnaire was 4.43.
The mean total IgE of the series was 306.83 KU/L, the mean specific IgE level against peach allergen Pru p 3 was 11.68 KU/L, and the mean IgG4 against peach allergen Pru p 3 was 0.81 mg/L; 210 out of 213 patients (98.59%) had a positive specific IgE test to Pru p 3.
Regarding foods implicated in allergic reactions, 227 patients (96.19%) reported symptoms with fruits and 210 patients (88.98%) had clinical manifestations with nuts. The foods that were most often implicated in allergic reactions and the symptoms provoked are given in Table 2. The most frequently involved food was peach, producing symptoms in 167 patients (70%), followed by walnut in 130 (55%), peanut in 107 (45%), hazelnut in 104 (44%), and apple in 91 (38%) patients. Regarding food that provoked anaphylaxis, walnut was the most frequent (16.10%), along with peach (15.68%), followed by peanut, hazelnut, almond, sunflower seed, and apple.
Table 2 Most frequently implicated foods and symptoms.
| No. of patients, 236 | Anaphylaxis N (%) | Urticaria-angioedema N (%) | Oral allergy syndrome N (%) | Total N (%) |
|---|---|---|---|---|
| Hazelnut | 27 (11.44) | 41 (17.37) | 36 (15.25) | 104 (44.06) |
| Peanut | 30 (12.71) | 43 (18.22) | 34 (14.41) | 107 (45.44) |
| Almond | 26 (11.02) | 33 (13.98) | 24 (10.17) | 83 (35.17) |
| Sunflower seed | 22 (9.32) | 29 (12.29) | 29 (12.29) | 80 (33.90) |
| Pistachio | 14 (5.93) | 25 (10.59) | 20 (8.47) | 59 (24.99) |
| Walnut | 38 (16.10) | 45 (19.07) | 47 (19.92) | 130 (55.09) |
| Peach | 37 (15.68) | 80 (33.90) | 50 (21.19) | 167 (70.77) |
| Apple | 21 (8.90) | 34 (14.41) | 36 (15.25) | 91 (38.56) |
| Pear | 8 (3.39) | 9 (3.81) | 20 (8.47) | 37 (15.67) |
| Kiwi | 13 (5.51) | 15 (6.36 ) | 37 (15.68) | 65 (27.55) |
| Banana | 9 (3.81) | 16 (6.78) | 36 (15.25) | 61 (25.84) |
| Melon | 13 (5.51) | 11 (4.46) | 34 (14.41) | 58 (24.58) |
| Strawberry | 6 (2.54) | 8 (3.39) | 18 (7.63) | 32 (13.66) |
| Pineapple | 6 (2.54) | 11 (4.66) | 16 (6.78) | 33 (13.98) |
| Tomato | 12 (5.08) | 10 (4.24) | 24 (10.17) | 46 (19.49) |
| Celery | 9 (3.81) | 4 (1.69) | 16 (6.78) | 29 (12.29) |
| Paprika | 10 (4.24) | 8 (3.39) | 11 (4.66) | 29 (12.29) |
| Wheat | 5 (2.12) | 2 (0.85) | 8 (3.39) | 15 (6.36) |
| Corn | 7 (2.97) | 10 (4.24) | 6 (2.54) | 23 (9.75%) |
A total of 226 (95.76%) patients had a positive skin prick test for peach allergen Pru p 3, and 10 patients had a negative one, although all of them had a positive specific IgE LTP peach Pru p 3. Table 3 shows the results of skin prick tests for foods and panallergens (ubiquitous allergenic proteins). Apart from peach LTP extract, the food that produced a more positive skin prick test was hazelnut (74.22%), followed by peanut (73.54%) and walnut (70.98%). Regarding fruits, peach (pulp) had 53.81%, apple had 49.33%, and kiwi had 43.78% positive results. Only 9.72% of our patients had a positive skin prick test to profilin.
Table 3 Skin prick test to food and panallergens.
| Positive n (%) |
Negative n (%) | |
|---|---|---|
| LTP peach | 226 (95.76) | 10 (4.24) |
| Profilin | 21 (9,72%) | 195 (90,28%) |
| Hazelnut | 167 (74.22) | 58 (25.78) |
| Peanut | 164 (73.54) | 59 (26.46) |
| Walnut | 159 (70.98) | 65 (29.02) |
| Almond | 86 (38.74) | 136 (61.26) |
| Sunflower seed | 120 (53.81) | 103 (46.19) |
| Pistachio | 101 (45.50) | 121 (54.50) |
| Peach (pulp) | 120 (53.81) | 103 (46.19) |
| Apple | 111 (49.33) | 114 (50.67) |
| Pear | 22 (10.58) | 186 (89.42) |
| Kiwi | 95 (43.78) | 122 (56.22) |
| Banana | 35 (15.98) | 184 (84.02) |
| Melon | 38 (18.10) | 172 (81.90) |
| Strawberry | 50 (24.39) | 155 (75.61) |
| Pineapple | 21 (10.45) | 180 (89.55) |
| Tomato | 87 (42.23) | 119 (57.77) |
| Celery | 37 (19.07) | 157 (80.93) |
| Paprika | 84 (43.98) | 107 (56.02) |
| Wheat | 16 (10.26) | 140 (89.74) |
We performed a microarray ImmunoCAP ISAC in 180 patients. The results are shown in Table 4. Specific IgE against Pru p3 was positive in 173 (96.11%) patients, followed by Jug r3 allergen in 162 (90%), and Ara h9 allergen in 144 (80%) patients. Pla a3 allergen in 134 patients (74.44%) and Art v3 allergen in 127 (70.55%) patients were the most frequently discovered positive pollen.
Table 4 IgE LTP – microarray ISAC.
| No. of patients, 180 | Positive | % | Mean | SD |
|---|---|---|---|---|
| Pru p3 | 173 | 96.11 | 6.38 | 9.86 |
| Jug r3 | 162 | 90.00 | 4.76 | 6.84 |
| Ara h9 | 144 | 80.00 | 3.42 | 4.73 |
| Cor a8 | 121 | 67.22 | 3.18 | 4.24 |
| Tri a14 | 27 | 15.00 | 3.75 | 10.35 |
| Pla a3 | 134 | 74.44 | 3.70 | 4.73 |
| Art v3 | 127 | 70.55 | 3.72 | 5.18 |
| Ole e7 | 54 | 30.00 | 9.04 | 14.07 |
| Par j2 | 45 | 25.00 | 12.35 | 17.6 |
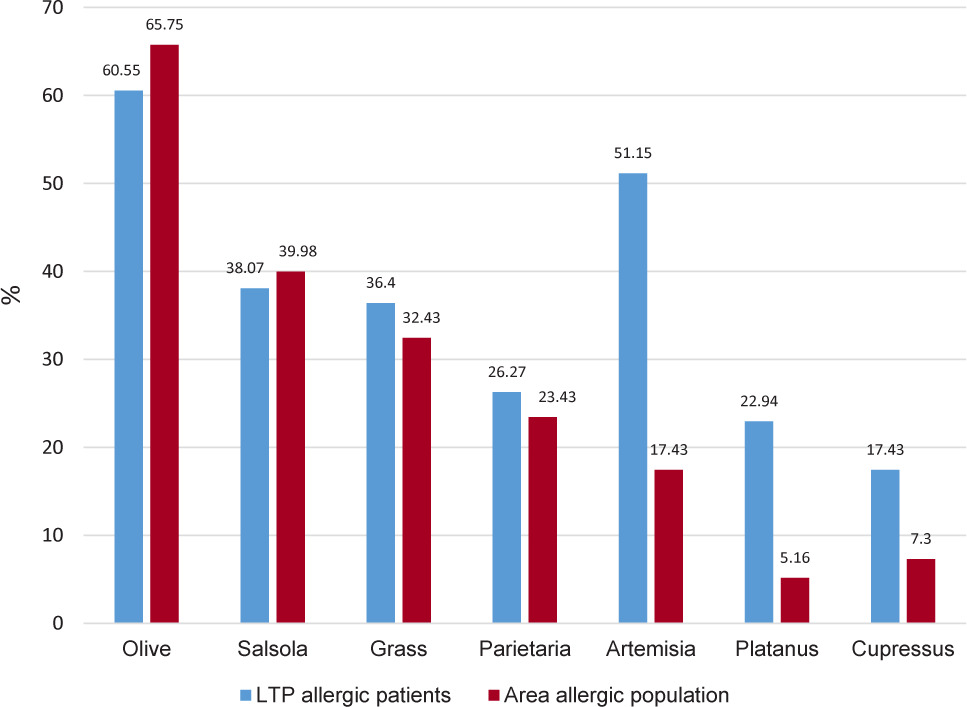
Figure 1 shows sensitization to aeroallergens in our patients. The profile was similar to the general allergic population of the area with olive, Salsola, grass, and Parietaria pollen. However, Artemisia, Platanus, and Cupressus to a lesser extent, were more frequent in patients allergic to LTP, highlighting that more than half of the patients allergic to LTP were sensitized to Artemisia pollen.
Figure 1 Positive skin prick test for pollens.
We characterized our most severe patients, comparing the presence of anaphylaxis with other variables. No significant differences were found regarding gender, age of the patients, and the involved food group, nor in the FAQLQ questionnaire score, which was 4.45 in patients with anaphylaxis and 4.39 in patients without anaphylaxis. Regarding the associated pollen respiratory symptoms, 37.99% of the patients with anaphylaxis had bronchial asthma (alone or in combination with rhinitis), compared to 30.38% in patients without anaphylaxis, bordering statistical significance (P = 0.052).
We discovered significant differences in the presence of cofactors in allergic reaction, with 48.84% of cofactors in patients with anaphylaxis, compared to 27.1% in patients without anaphylaxis (P < 0.0001). Regarding allergy background in family, it was more frequent in patients with anaphylaxis (96.12%) than in patients without anaphylaxis (82.24%; P < 0.0001).
Regarding serological parameters, we did not discover significant differences between patients with and without anaphylaxis in total levels of IgE (255 KU/L in patients with anaphylaxis and 377 KU/L in patients without anaphylaxis), specific IgE against Pru p3 (11.28 KU/L in patients with anaphylaxis and 12.21 KU/L in patients without anaphylaxis), and IgG4 to Pru p3 (0.83 mg/L KU/L in patients with anaphylaxis and 0.78 mg/L in patients without anaphylaxis).
Regarding the microarray ImmunoCAP ISAC, the mean number of positive LTP in patients with anaphylaxis was 5.18 and without anaphylaxis, it was 5.04, without statistical significance. We didn’t obtain statistically significant difference if the mean values of concentration of IgE to each LTP were compared in patients with and without anaphylaxis.
Similarly, no significant differences were discovered regarding positive skin prick tests for foods or profilin and severity. Finally, regarding tests with aeroallergens, patients with anaphylaxis had a more significant number of positive tests for Artemisia pollen (57.02%) than patients without anaphylaxis (44.06%; P = 0.046), not finding significant differences in rest of aeroallergens.
In all, 123 patients underwent specific sublingual immunotherapy with Pru p3 extract (SLIT-peach®; ALK-Abello, Madrid, Spain).
Discussion
The patients examined in our LTP allergy clinic were generally severe, with more than half presenting anaphylaxis. Patients with anaphylactic reactions had asthma more frequently, with almost reaching statistical significance. However, according to a recent review, the diagnosis of asthma was not a risk factor for more severe food allergic reactions.10
Factors significantly associated with having an anaphylactic reaction were the cofactors,11 the most frequent being NSAIDs,12 physical exercise as well as family allergy background.
Notably, the FAQLQ quality of life questionnaire score was almost similar in patients with and without anaphylaxis, suggesting that quality of life was not affected by the severity of anaphylactic reaction, as reported by other authors.13,14 It could be more affected by other factors, such as dietary or social restrictions.
The foods most frequently implicated were fruits, mainly peach and apple, and nuts, especially walnuts, peanuts, and hazelnuts. Similar results were reported by other authors.15,16
Comparing skin prick tests with the symptoms caused by each food, we discovered more patients with positive skin prick tests than patients with reported symptoms with that food, illustrating that there could be frequent subclinical food sensitizations in LTP allergy. Apart from the LTP of peach, the foods with the most positive skin prick tests were hazelnut, peanut, and walnut. We determined found, compared with Bogas et al. in their series, more patients sensitized to nuts, similar figures were discovered for apples and bananas, but and fewer patients were determined sensitized to melon than the patients discovered by Bogas et al. in their series, possibly reflecting different food exposures in other Mediterranean areas of Spain.1
We didn’t find any relationship between the severity of anaphylactic reaction and the serological parameters of patients: total IgE, specific IgE to Pru p3, and IgG4 to Pru p3, number of positive LTP in ISAC, or specific IgE levels to different LTPs in ImmunoCAP ISAC assay. Although significant changes in Pru p 3-specific IgE and IgG4 levels were described after immunotherapy with peach extract,17 the basal level of these parameters didn’t seem to affect the severity of clinical presentation.
Indolfi et al. showed an increase in sensitization to nsLTP in 800 Italian pediatric patients from 2010 to 2020.8 These figures were lower than the figures discovered in the present study because the patients were from a general allergy clinic and not from a monographic LTP allergy consultation. The distribution of positive nsLTP molecules examined in the cited series was similar to that discovered in our series, Pru p3 allergen being the most frequent allergy in foods (46%), followed by Jug r3 (34.2%), Ara h9 (31.2%), and Cor a8 (30%) allergies. Regarding pollens, Indolfi et al. also determined similar figures for Art v3 and Pla a3, much higher than those for Ole e7.8 These figures showed a similar pattern of sensitization between different Mediterranean regions.
Only a small percentage of our patients allergic to LTP were also sensitized to profilin (9.72%), which could be related to an elevated proportion of patients with severe food allergy in our series.18,19
Regarding pollen sensitization, as expected, positive skin prick tests for Artemisia and Platanus pollen were more frequent in patients allergic to LTP because of the presence of LTP in these pollens. However, sensitization to olive and Parietaria pollen was similar to the general allergic population in our area, suggesting a different role of Ole e7 and Par j2 allergens, compared with Pla a3 and Art v3 allergens.20
Our results showed that patients with anaphylactic reactions due to LTP allergy had similar characteristics to the patients with less severe anaphylactic reactions. Because the presence of cofactors is highly relevant in determining the severity of anaphylactic the reaction, patients allergic to LTP must be instructed to avoid cofactors when eating foods containing LTP.
One of the limitations of our study was that the patients were selected from a monographic LTP consultation, in which all patients were sensitized to LTP, as demonstrated by skin prick test or specific IgE, and in which all of them presented symptoms after ingestion of foods containing LTP, which would make the results reflect the characteristics of more severe patients, among those sensitized to LTP.
We considered a positive result as Pru p 3-specific IgE >0.1 KU/L. Although the clinical relevance of low-level serum allergen specific immunoglobulin E (sIgE) (0.1–0.35 kUA/L) remains controversial, available information suggests that sIgE concentrations between 0.1 kUA/L and 0.35 kUA/L may be clinically relevant in some individuals.21,22 In our series, only five patients had a Pru p 3 sIgE level between 0.1 kUA/L and 0.34 kUA/L, all of them had a positive skin prick test to LTP extract, and all presented symptoms after eating food containing LTP, three suffering from urticaria and two from anaphylaxis.
Conclusion
In our extensive series of patients allergic to LTP, more than half of them presented anaphylaxis, and the foods that most frequently produced symptoms were peaches, apples, and nuts. The parameters associated with the severity of anaphylactic reaction were the presence of cofactors, allergy background in family, and a positive skin prick test for Artemisia pollen.
Conflicts of Interest
None of the authors has any conflict of interest.
Author Contributions
Juan Carlos Miralles-López designed the study, collected the data, interpreted the results and reviewed the paper. Antonio Carbonell-Martínez, Soledad Zamarro-Parra, Cristina Navarro-Garrido, Ana Isabel Escudero-Pastor, Muna Boulaich, Sol Sanromán-Sirvent, Yulia Petryk-Petryk, and Maria Dolores Ladrón-de-Guevara collected the data, interpreted the results and reviewed the paper. Virginia Pérez-Fernández carried out the statistical analysis, interpreted the results, and reviewed the paper. All authors reviewed the final manuscript and gave their consent for publication.
REFERENCES
1. Bogas G, Muñoz-Cano R, Mayorga C, Casas, Bartra J, Pérez N, et al. Phenotyping peach-allergic patients sensitised to lipid transfer protein and analysing severity biomarkers. Allergy 2020; 75(12):3228–3236. 10.1111/all.14447
2. Skypala IJ, Asero R, Barber D, Cecchi L, Diaz Perales A, Hoffmann-Sommergruber K et al. Non-specificlipid-transferproteins: Allergen structure and function, cross-reactivity, sensitisation, and epidemiology. Clinical and Translational Allergy 2021; 11(3):e12010. 10.1002/clt2.12010
3. Asero R, Pravettoni V, Scala E, Villalta D. Lipid transfer protein allergy: A review of current controversies. Clin Exp Allergy. 2022 Feb;52(2):222–230. 10.1111/cea.14049
4. Pali-Schöll I, Untersmayr E, Klems M, Jensen-Jarolim E. The Effect of Digestion and Digestibility on Allergenicity of Food. Nutrients. 2018; 10(9):1129. 10.3390/nu10091129
5. Asero R, Piantanida M, Pinter E, Pravettoni V. The clinical relevance of lipid transfer protein. Clin Exp Allergy. 2018;48(1): 6–12. 10.1111/cea.13053
6. Flokstra-de Blok BMJ, van der Meulen GN, Dunn Galvin A, Vlieg-Boerstra J, Oude Elberink JNG, Duiverman EJ, et al. Development and validation of the Food Allergy Quality of Life Questionnaire–Adult Form. Allergy 2009;64:1209–1217. 10.1111/j.1398-9995.2009.01968.x
7. Antolin-Amerigo D, Cerecedo Carballo I, Muriel A, Fernández-Rivas M, Diéguez Pastor M, Flokstra-de Blok B et al. Validation of the Spanish Version of the Food Allergy Quality of Life Questionnaire–Adult Form (S-FAQLQ-AF). J Investig Allergol Clin Immunol 2015; 25:270–275.
8. Indolfi C, Dinardo, Klain A, Contieri M, Umano GR, Decimo F, et al. Sensitization to nsLTP: A Retrospective Study in An Italian Pediatric Population over the Last Decade. J Immunol Res 2023: 4053799. 10.1155/2023/4053799
9. Asero R, Pravettoni V, Villalta D, Cecchi L, Scala E. IgE-Mediated Reactivity to Non-Specific Lipid Transfer Protein (nsLTP): Clinical Implications and Management. Consensus Document of the Association of Italian Territorial and Hospital Allergists and Immunologists (AAIITO). Eur Ann Allergy Clin Immunol 2023. 10.23822/EurAnnACI.1764-1489.316
10. Turner PJ, Arasi S, Ballmer-Weber B, Baseggio Conrado A, Deschildre A, Gerdts J, et al. Risk factors for severe reactions in food allergy: Rapid evidence review with meta-analysis. Allergy 2022;77:2634–2652. 10.1111/all.15318
11. Cardona V, Luengo O, Garriga T, Labrador-Horrillo M, Sala-Cunill A, Izquierdo A, et al. Co-factor-enhanced food allergy. Allergy. 2012;67:1316–1318. 10.1111/j.1398-9995.2012.02877.x
12. Pascal M, Muñoz-Cano R, Mila J, et al. Nonsteroidal anti--inflammatory drugs enhance IgE-mediated activation of human basophils in patients with food anaphylaxis dependent on and independent of nonsteroidal anti-inflammatory drugs. Clin Exp Allergy 2016;46:1111–1119. 10.1111/cea.12735
13. Flokstra-De Blok BMJ, van der Velde JL, Vlieg-Boerstra BJ, Oude Elberink JN, DunnGalvin A, Hourihane JO, et al. Health-related quality of life of food allergic patients measured with generic and disease-specific questionnaires. Allergy. 2010; 65(8): 1031–1038. 10.1111/j.1398-9995.2009.02304.x
14. Morou Z, Vassilopoulou E, Galanis P, Tatsioni A, Papadopoulos NG, Dimoliatis IDK. Investigation of quality of life determinants in children with food allergies. Int Arch Allergy Immunol 2021;182:1058–1065. 10.1159/000516875
15. Mota I, Gaspar Â, Benito-Garcia F, Correia M, Arêde C, Piedade S et al. Anaphylaxis caused by lipid transfer proteins: an unpredictable clinical syndrome. Allergol Immunopathol (Madr). 2018 Nov-Dec;46(6):565–570. 10.1016/j.aller.2018.04.002
16. Basagaña M, Elduque C, Teniente-Serra A, Casas I, Roger A. Clinical profile of lipid transfer protein syndrome in a Mediterranean area. J Investig Allergol Clin Immunol. 2018;28(1):58–60. 10.18176/jiaci.0209
17. González Pérez A, Carbonell Martínez A, Escudero Pastor AI, Navarro Garrido C, Miralles López JC. Pru p 3 oral immunotherapy efficacy, induced immunological changes and quality of life improvement in patients with LTP syndrome. Clin Transl Allergy. 2020 Jun 8;10:20. 10.1186/s13601-020-00325-y
18. Pastorello EA, Farioli L, Pravettoni V, Scibilia J; Mascheri A, Borgonovo L, et al. Pru p 3-sensitised Italian peach-allergic patients are less likely to develop severe symptoms when also presenting IgE antibodies to Pru p 1 and Pru p 4. Int Arch Allergy Immunol 2011;156:362–72. 10.1159/000324440
19. Scala E, Abeni D, Guerra EC, Locanto M, Pirrotta L, Meneguzzi G, et al. Cosensitization to profilin is associated with less severe reactions to foods in nsLTPs and storage proteins reactors and with less severe respiratory allergy. Allergy. 2018;73:1921–1923. 10.1111/all.13501
20. Tordesillas L, Sirvent S, Díaz-Perales A, Villalba M, Cuesta-Herranz J, Rodríguez R, et al. Plant lipid transfer protein allergens: no cross-reactivity between those from foods and olive and Parietaria pollen. Int Arch Allergy Immunol. 2011;156(3):291–296. 10.1159/000323503
21. Balsells-Vives S, San Bartolomé C, Casas-Saucedo R, Ruano-Zaragoza M, Rius J, Torradeflot M et al. (Low Levels Matter: Clinical Relevance of Low Pru p 3 sIgE in Patients With Peach Allergy. Front Allergy 2022:3:868267. 10.3389/falgy.2022.868267
22. Thorpe M, Movérare R, Fischer C, Lidholm MD, Rudengren M, Borres MP. History and utility of specific ige cutoff levels: What is the relevance for allergy diagnosis? J Allergy Clin Immunol Pract 2023; 11: 3021–3029. 10.1016/j.jaip.2023.05.022